
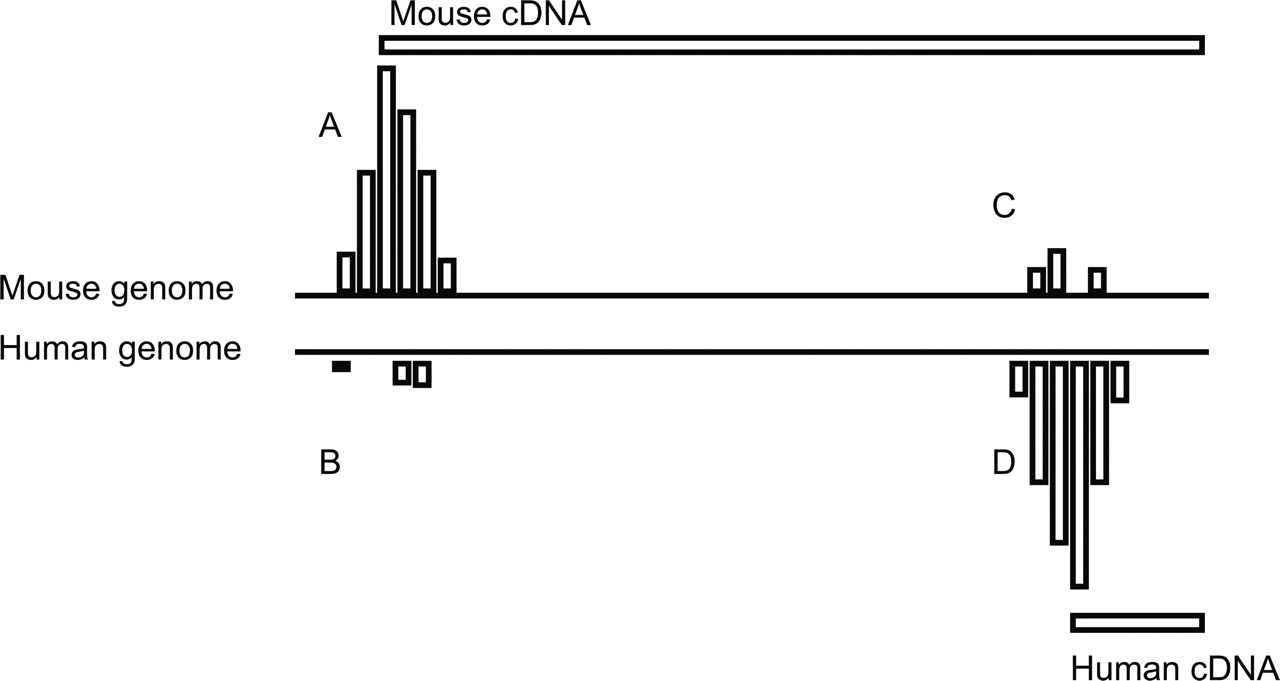
Figure 5.
Schematic view of pairs of TSSs undergoing turnover. This generalized representation of the panels in Figure 2 provides a reference for method descriptions. Labels A–D correspond to the four different promoters in the two species. The vertical bars indicate supporting CAGE tags.


