
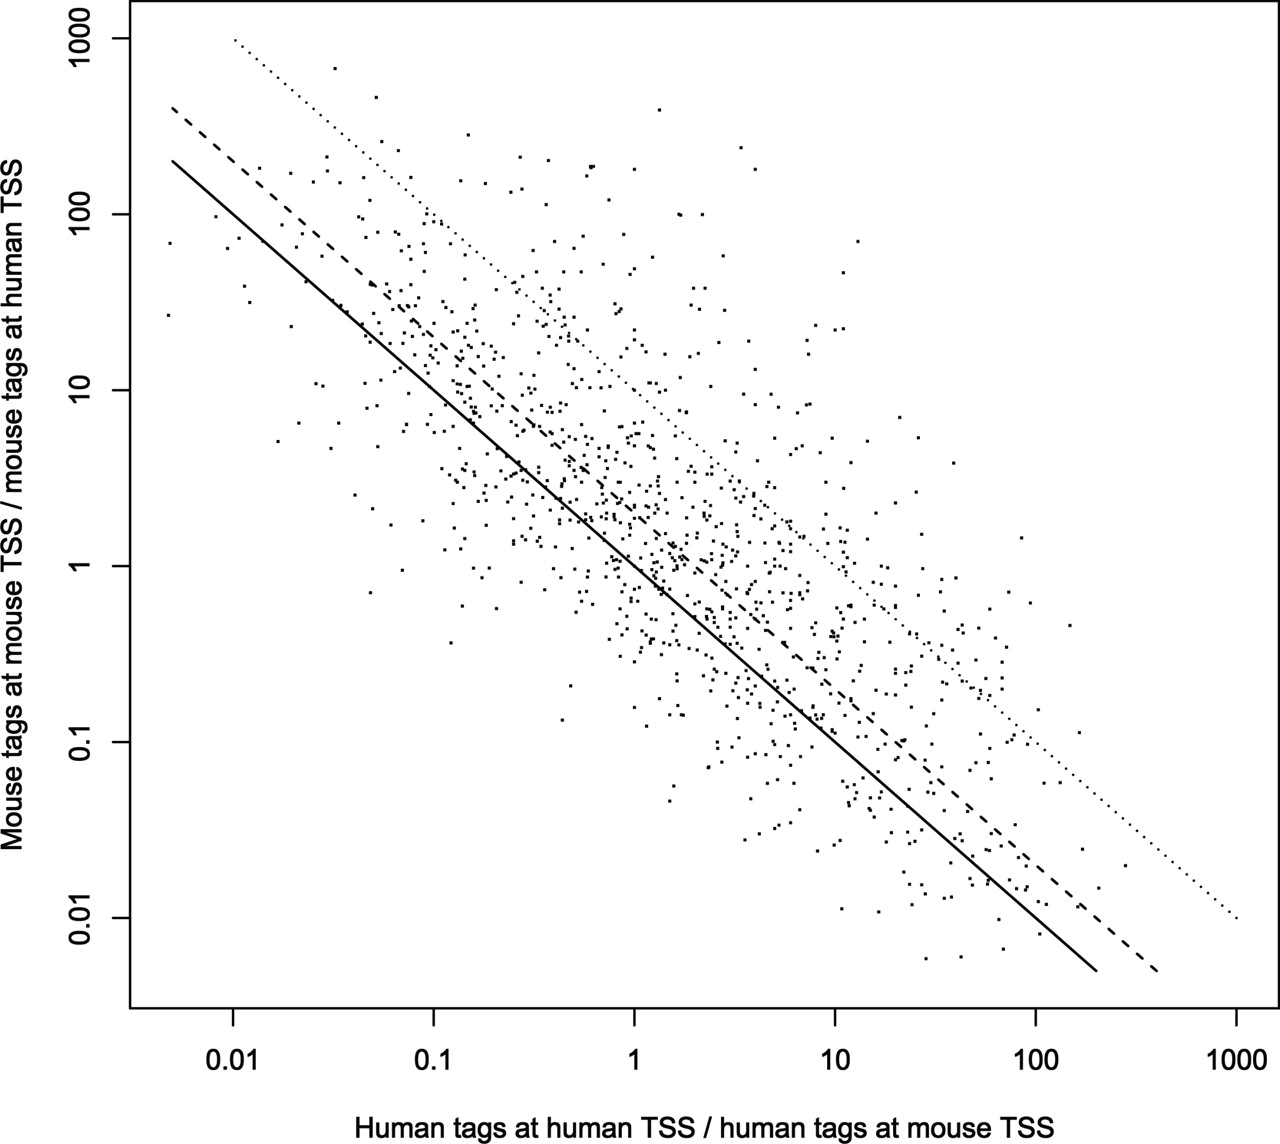
Figure 3.
Changes in usage of alternative promoters between human and mouse. We analyzed 1263 pairs of human and mouse TSSs of homologous transcripts. The x-axis indicates the number of CAGE tags at the human TSS region divided by the number of CAGE tags at the human position aligned to the mouse TSS region. The y-axis indicates the number of CAGE tags at the mouse TSS region divided by the number of CAGE tags at the mouse position aligned to the human TSS region. (Black line) No change in usage; (dashed line) twofold change in usage; (dotted line) 10-fold change in usage.


