
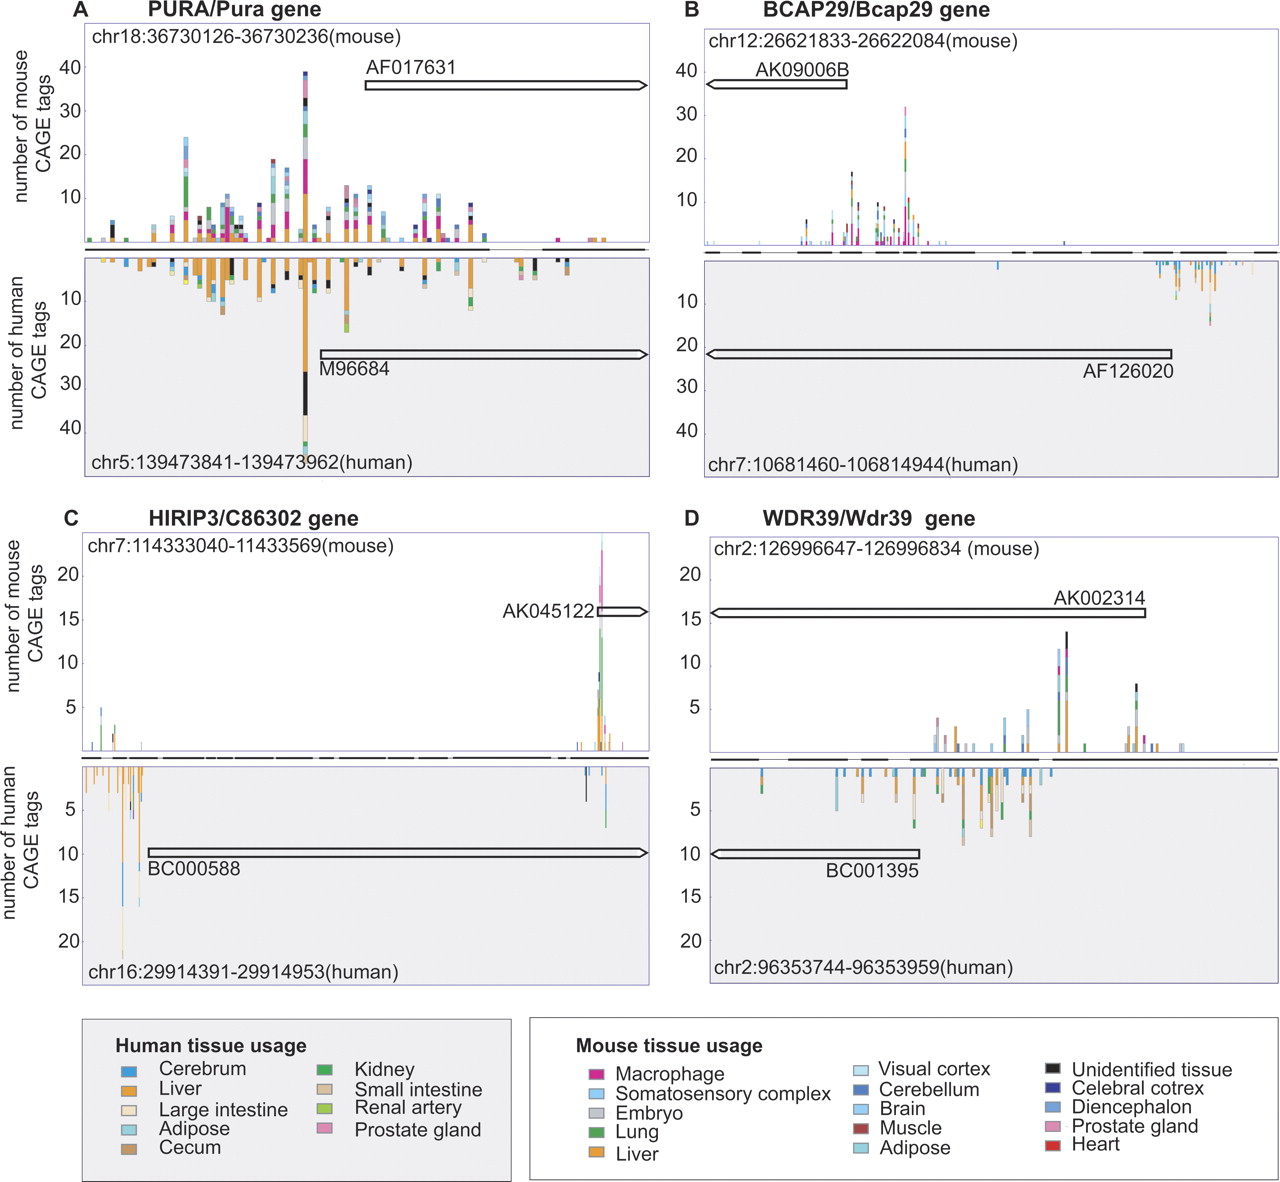
Examples of TSS usage and TSS turnover in promoters of homologous genes. Each histogram subplot is divided into two parts, displaying on the y-axis the CAGE tag distribution of the transcription start sites (TSSs) in the mouse genome (upper part) and of the homologous TSSs in the human genome (lower part). The number of CAGE tags originating from each analyzed tissue is indicated by the color legend (separate for mouse and human). The x-axis displays positions in the alignment between mouse and human; the line between the mouse and human TSS regions represents either aligned nucleotides (thick line) or insertions/deletions (thin line) in the BLASTZ promoter alignment. The homologous mRNAs used for defining the TSS pair (see text) are shown as black arrows with corresponding GenBank accession numbers, where the arrow indicates transcript direction. Full-size images with alignments are available in Supplemental Figure S1. The histograms illustrate different cases of TSS turnover. (A) No turnover (PURA/Pura gene). In most cases, homologous promoter regions have nearly identical TSS usage in the mouse and human genomes. (B) Complete TSS turnover (BCAP29/Bcap29 gene). The TSSs are separated by >100 nt and have zero CAGE tags proximal to the aligned regions in the other species. (C) Shift in alternate TSS usage (HIRIP3/C86302 gene). Similar to case B, but the aligned regions have retained a limited level of transcription initiation activity. (D) TSS sliding (WDR39/Wdr39 gene). The homologous TSS regions overlap, but the flanking regions have no TSSs at the aligned position in the other species.


