
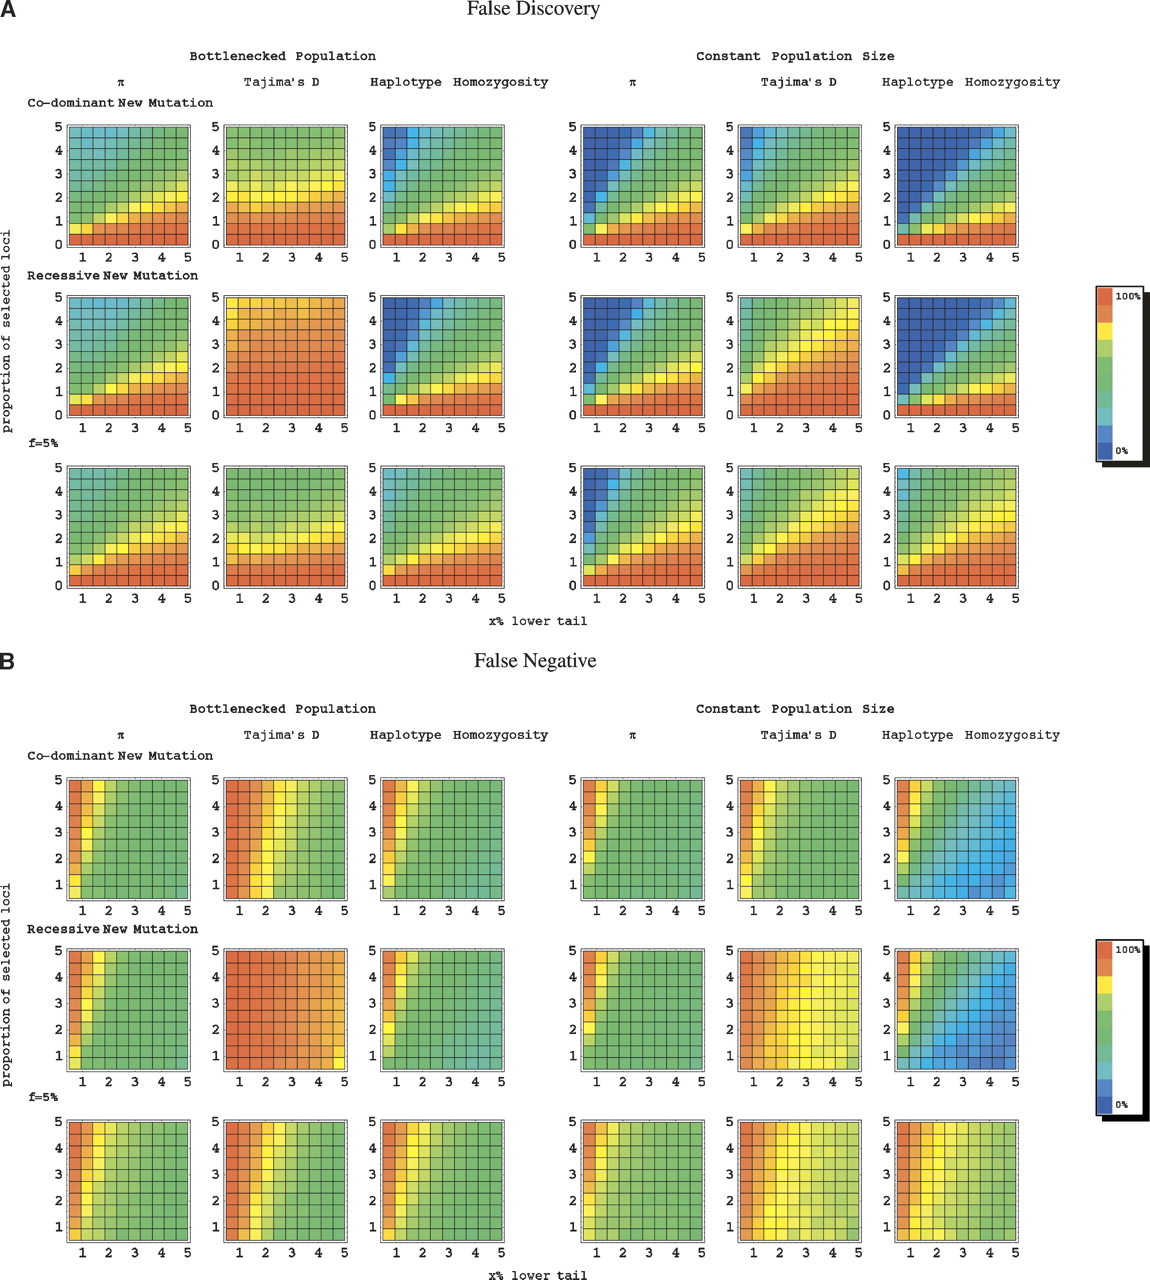
Figure 5.
An estimate of error rates using π, Tajima’s D, and haplotype homozygosity under the models for a human population. (A) The false-discovery rate and (B) the false-negative rate (see legend to Fig. 3 and Methods for details). The results for the following three scenarios are presented (from top to bottom rows): (1) Selection acted on a new, co-dominant allele (h = 0.5) at time τ. (2) Selection acted on a new, recessive allele (h = 0.1) at time τ. (3) Selection acted on a previously neutral mutation at frequency f = 0.05 at time τ.


