
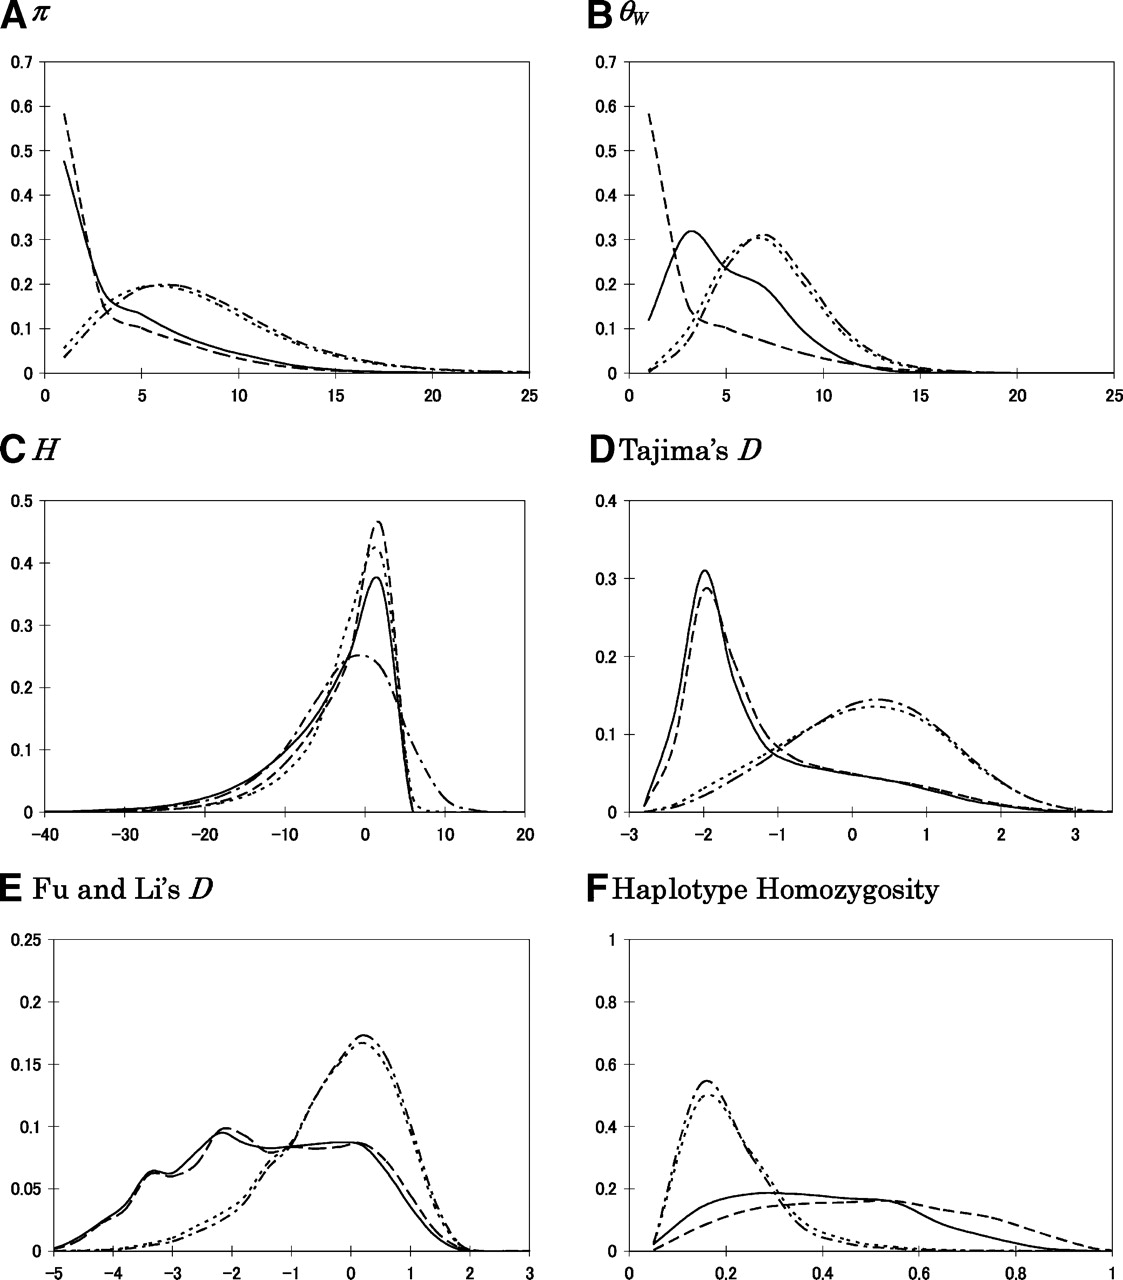
The distribution of summary statistics under the model for a human population. The value of the summary is on the x-axis and the proportion of simulated data sets with a given value on the y-axis. The statistics presented are (A) π, (B) θW, (C) H, (D) Tajima’s D, (E) Fu and Li’s D, and (F) haplotype homozyogosity (see Methods for details). The length of the simulated region is 10 kb; for the other parameter values, see Methods. The broken line is for a model of directional selection on a new mutation, the solid line for a model of directional selection where f = 0.05, the dotted line for a model of an incomplete selective sweep in which the favored allele arose 400 generations ago, and the dashed line for the neutral model. In calculating D and E, we excluded cases with no segregating sites (0.047% for the model of selection on a new mutation, 0.002% for the case where f = 0.05, and 0.004% for selection starting 400 generations ago). Note that under a neutral, constant size population model, E(π) = E(θW) = 11, E(H) = 0, and E(D) ≈ 0.


