
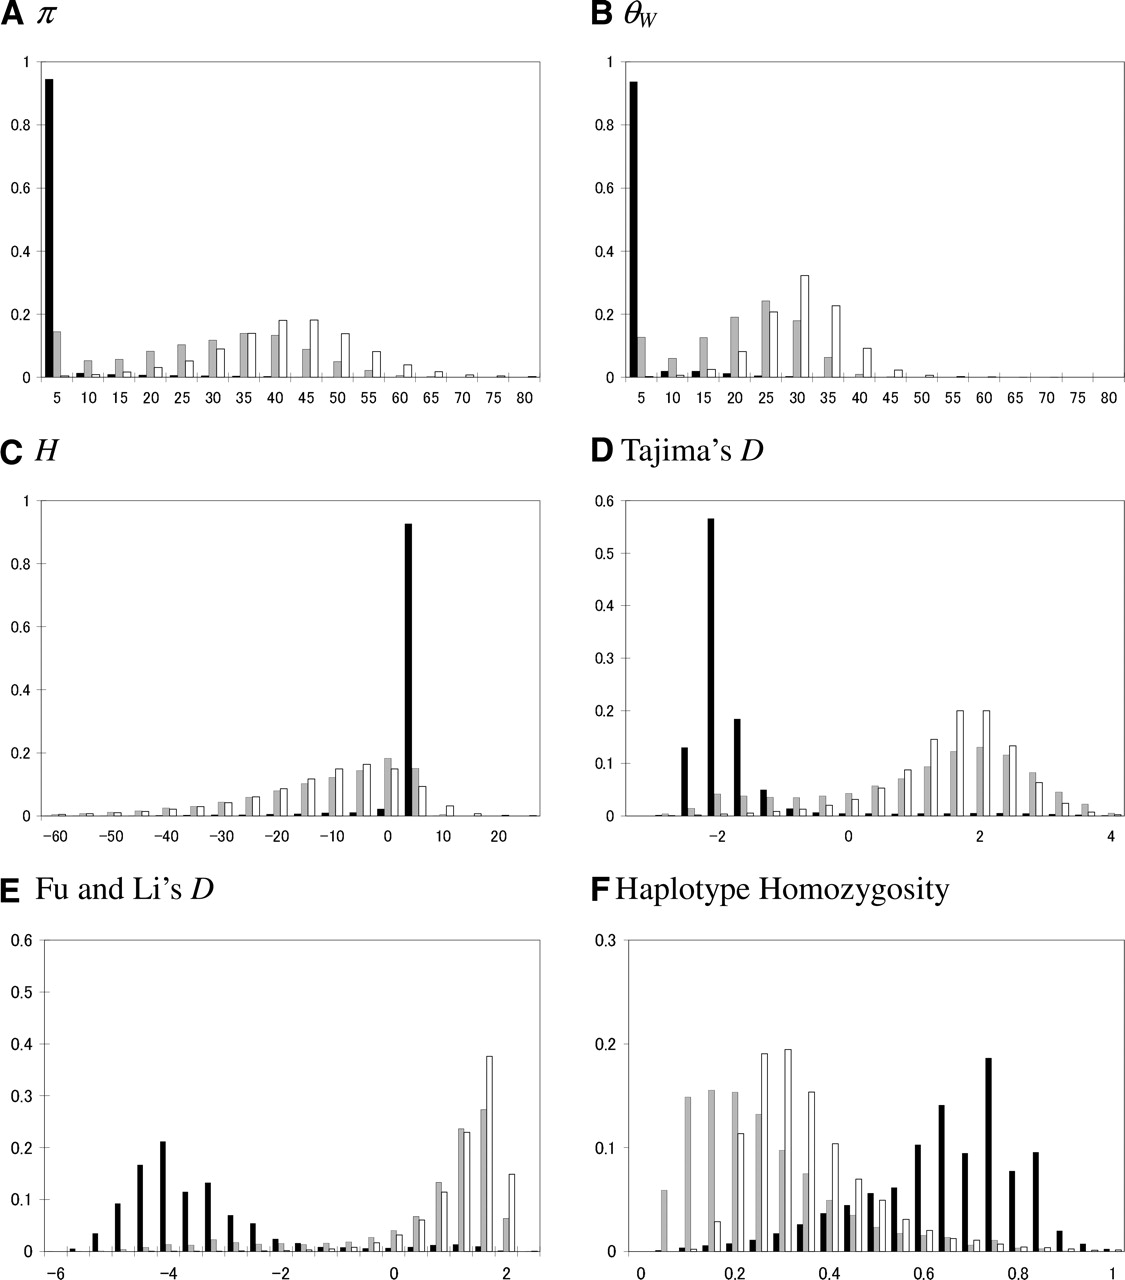
The distribution of summary statistics under the model for maize. The value of the summary is on the x-axis, and the proportion of simulated data sets with a given value is on the y-axis. The statistics presented are (A) π, (B) θW, (C) H, (D) Tajima’s D, (E) Fu and Li’s D, and (F) haplotype homozygosity (see Methods for details). The length of the simulated region is 5 kb; for the other parameter values, see Methods. In calculating D and E, we excluded cases with no segregating sites (0.03% of cases where selection acted on new mutations). The black histogram is for a model of directional selection on a new mutation (where h = 0.5), the gray for a model of directional selection where f = 0.05, and the white for the neutral model. Note that under a neutral, constant size population model, E(π) = E(θW) = 58.5, E(H) = 0, and E(D) ≈ 0.


