
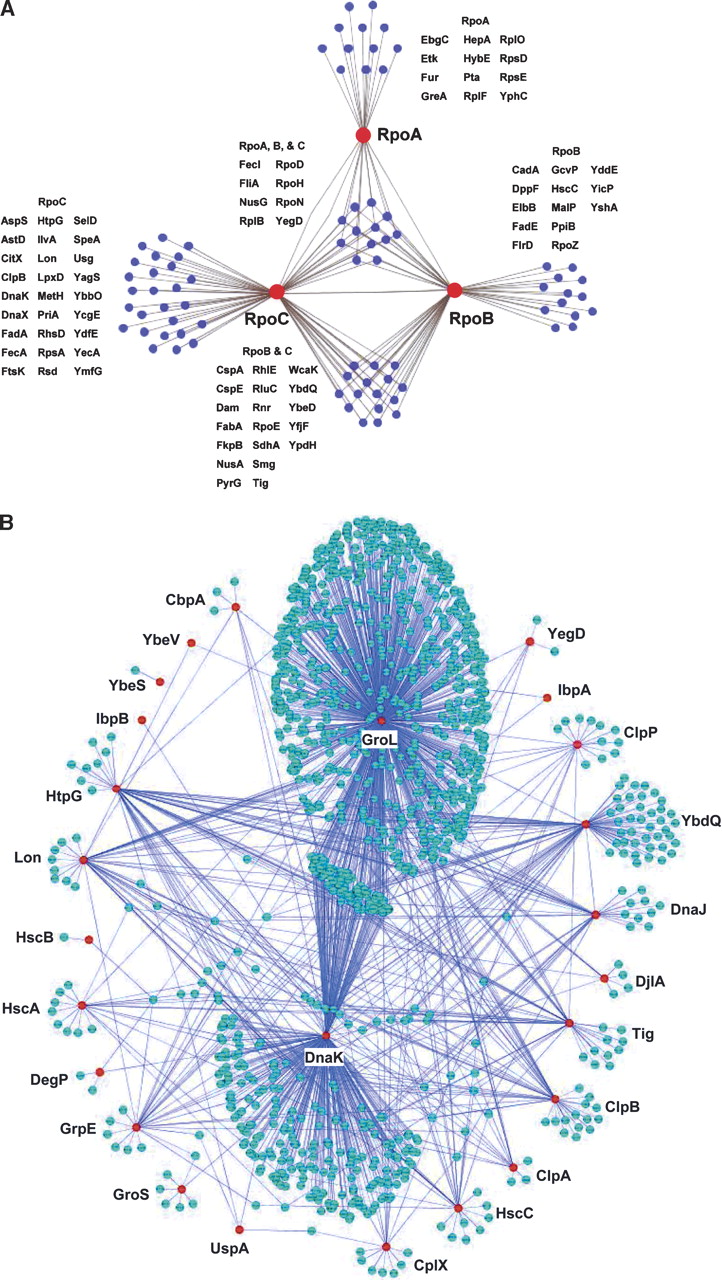
Figure 5.
Subgraph of protein–protein interactions. (A) RNAP interacting protein network. Networks of proteins that interact directly (blue nodes) with each of the RNAP subunits, RpoA, RpoB, and RpoC (red nodes). (B) Molecular chaperone and their target network properties. Red nodes represent major chaperone proteins and blue nodes represent their targets. The largest cluster shows the GroL interaction network and the second largest one shows the network of DnaK.


