
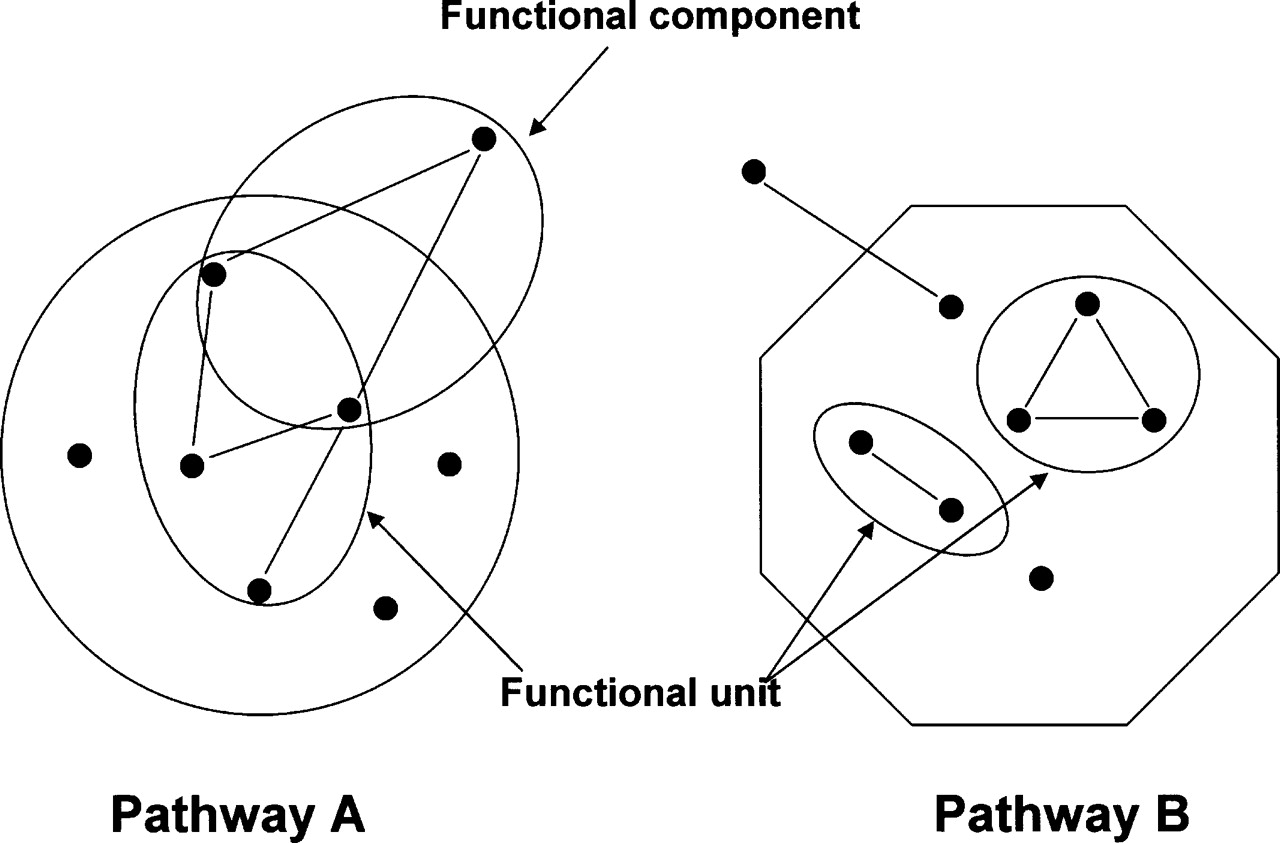
Schematic diagram for extracting protein–protein interaction pairs using KEGG pathway clusters. ORFs were clustered using KEGG database and encircled as Pathway A and B. Protein–protein interactions within the same cluster may be more plausible than those between different clusters and are defined as belonging to a functional unit. Proteins with an unknown function or proteins outside of a certain cluster that shows more than two independent interactions with proteins in the same cluster may also be plausible and were defined as functional components as encircled and marked by arrows. Node and arc represent protein and interaction, respectively.


