
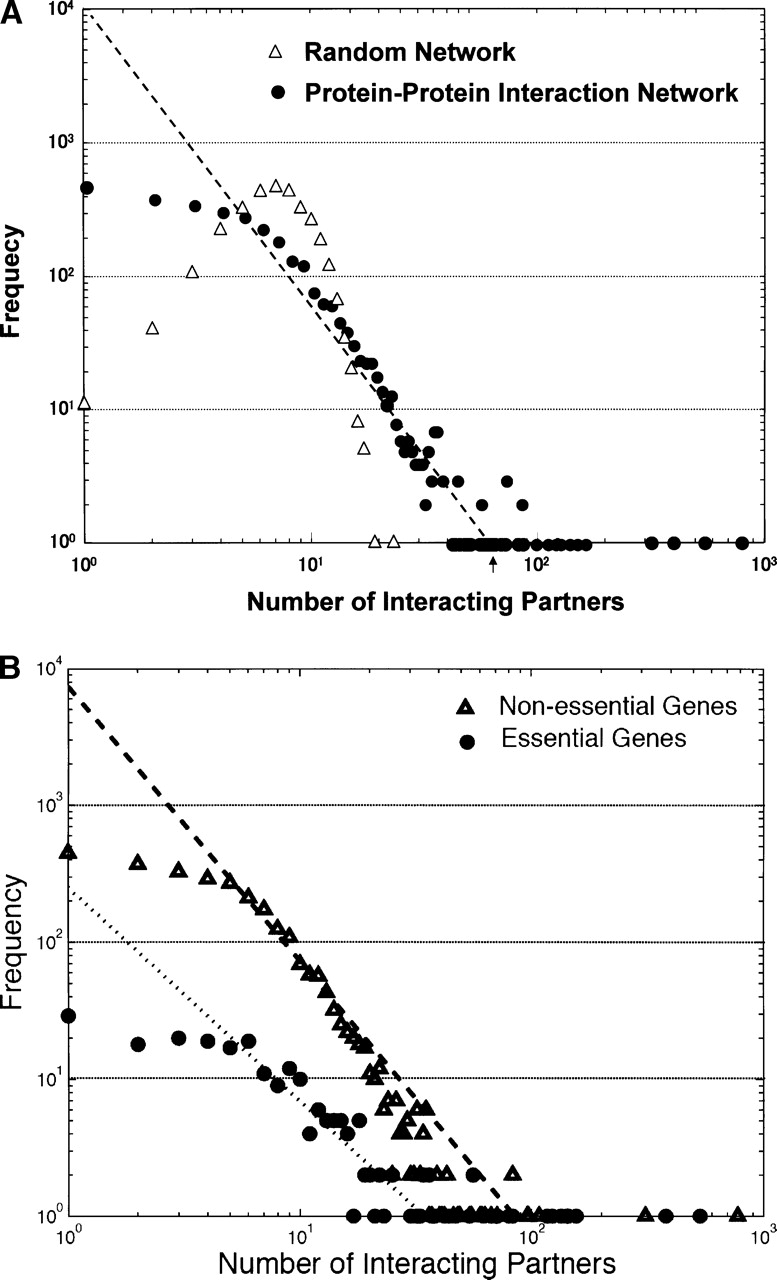
Figure 3.
Topological properties of protein–protein interaction network. (A) The frequency of all interacting partner proteins. x-axis represents the number of protein partners and y-axis represents the frequency. Experimental results and random generation of protein pairs having the same numbers of interactions are plotted. (B) The comparison of the frequency of interacting partner proteins between essential and nonessential gene products.


