
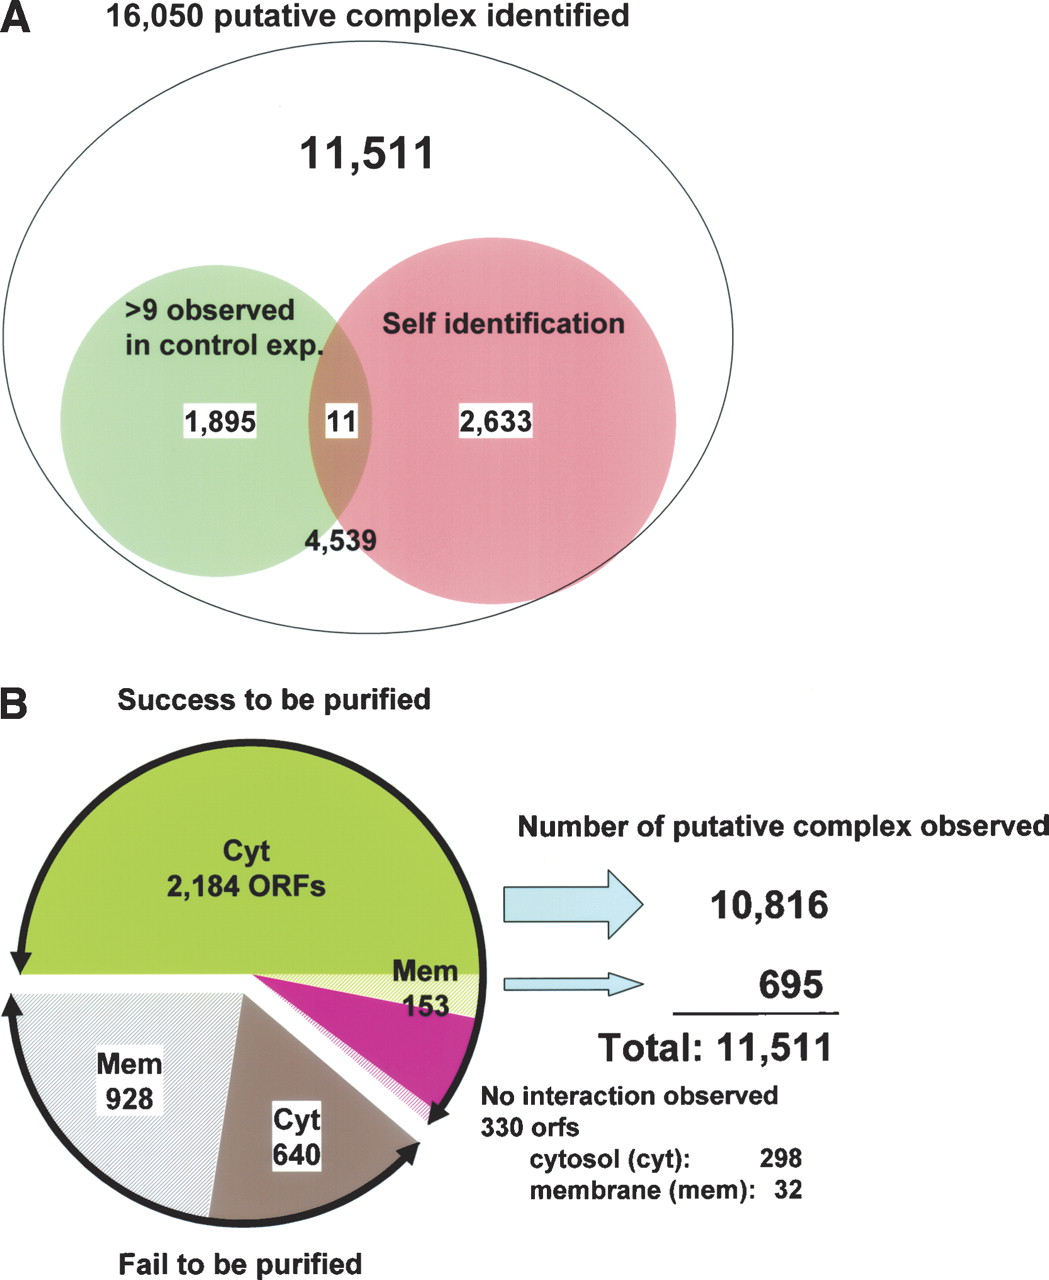
Statistics of putative protein–protein interaction in E. coli. (A) The top number represents the total protein–protein interaction identified in this study. Of the total interactions, the small left circle (pale green) represents the number of interactions with proteins that may have affinity to Ni2+-NTA resin based on our control experiments. The right circle (pale red) shows the number of prey proteins identified as the same protein as histidine-tagged bait protein, which include 11,511 for further analyses. Other 4539 interactions were excluded because their protein assignment was ambiguous. (B) Left: The green region represents the number of cytosolic bait proteins successfully purified. The pink region represents the number of purified bait proteins that had no protein–protein interaction partner. The gray region shows the bait proteins that we failed to purify. Hatched regions represent the baits predicted or known as membrane proteins. Right: Numbers represent the putative PPIs observed.


