
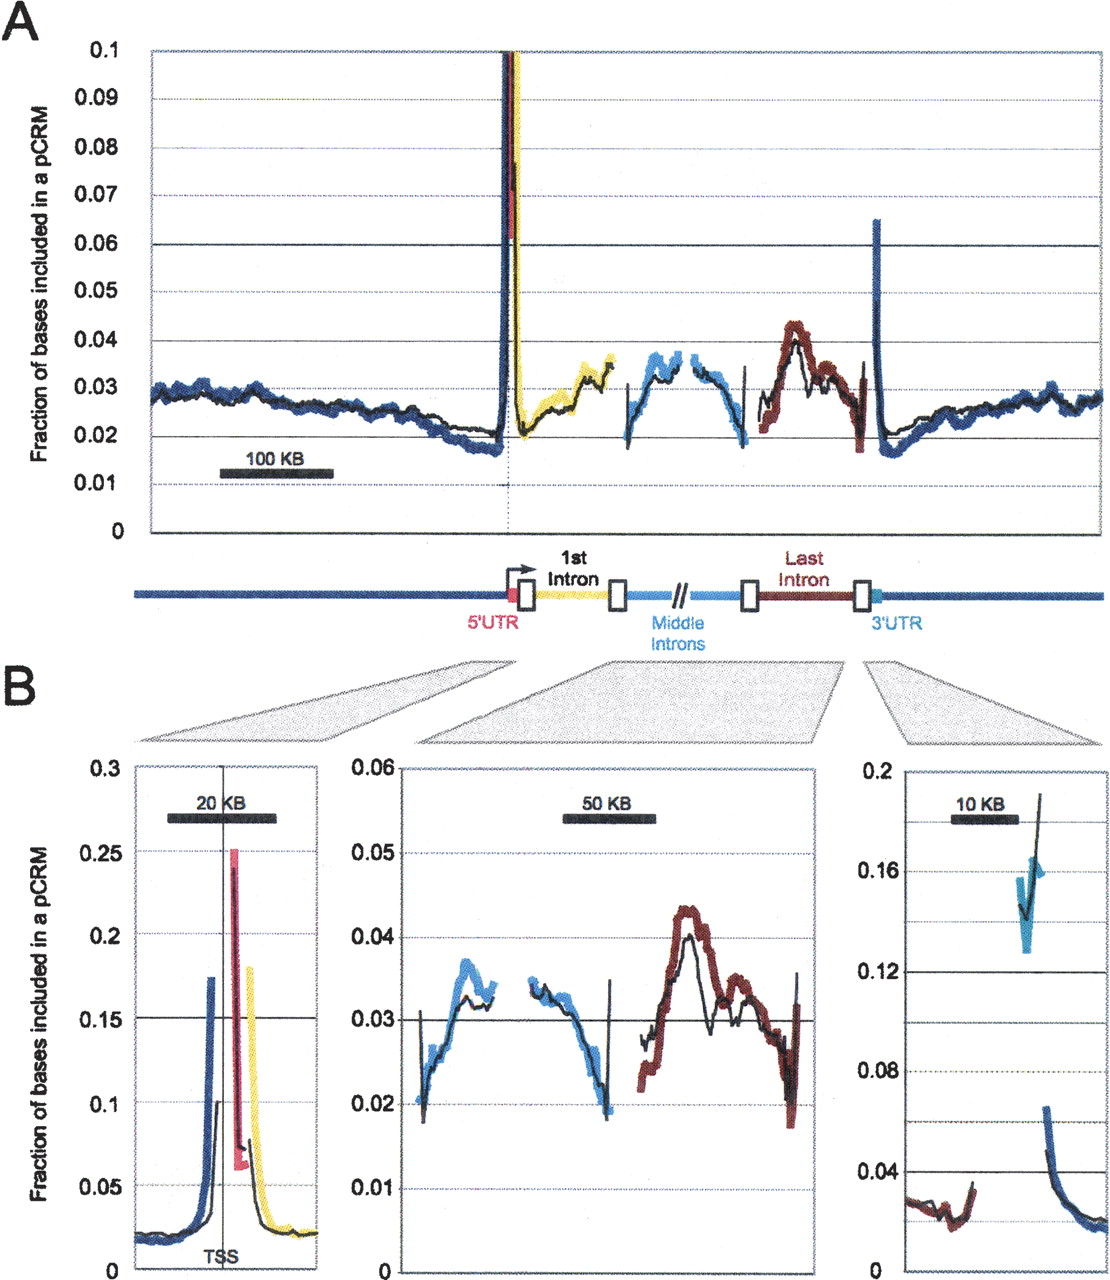
Distribution of pCRMs relative to specific regions of genes. The genome was divided into several types of noncoding regions: upstream of a gene (dark blue), 5′ UTR (pink), 1st intron (yellow), internal introns (light blue), last intron (brown), 3′ UTR (aqua), and downstream region (dark blue). (A) For each type of region, the fraction of bases included in a pCRM is graphed as a function of the distance to a reference point. For upstream regions, 5′ UTR, and first intron the reference point is the gene’s TSS. For middle introns the closest 5′ or 3′ intron boundary is used. For the last intron, the 3′ UTR and the region 3′ of the last exon, the 3′ end of the mRNA is used. Note that the 3′ UTR is off the scale in A. (B) Same as in A, but different scales are used for the x- and y-axes in order to better show the characteristics of all regions.


