
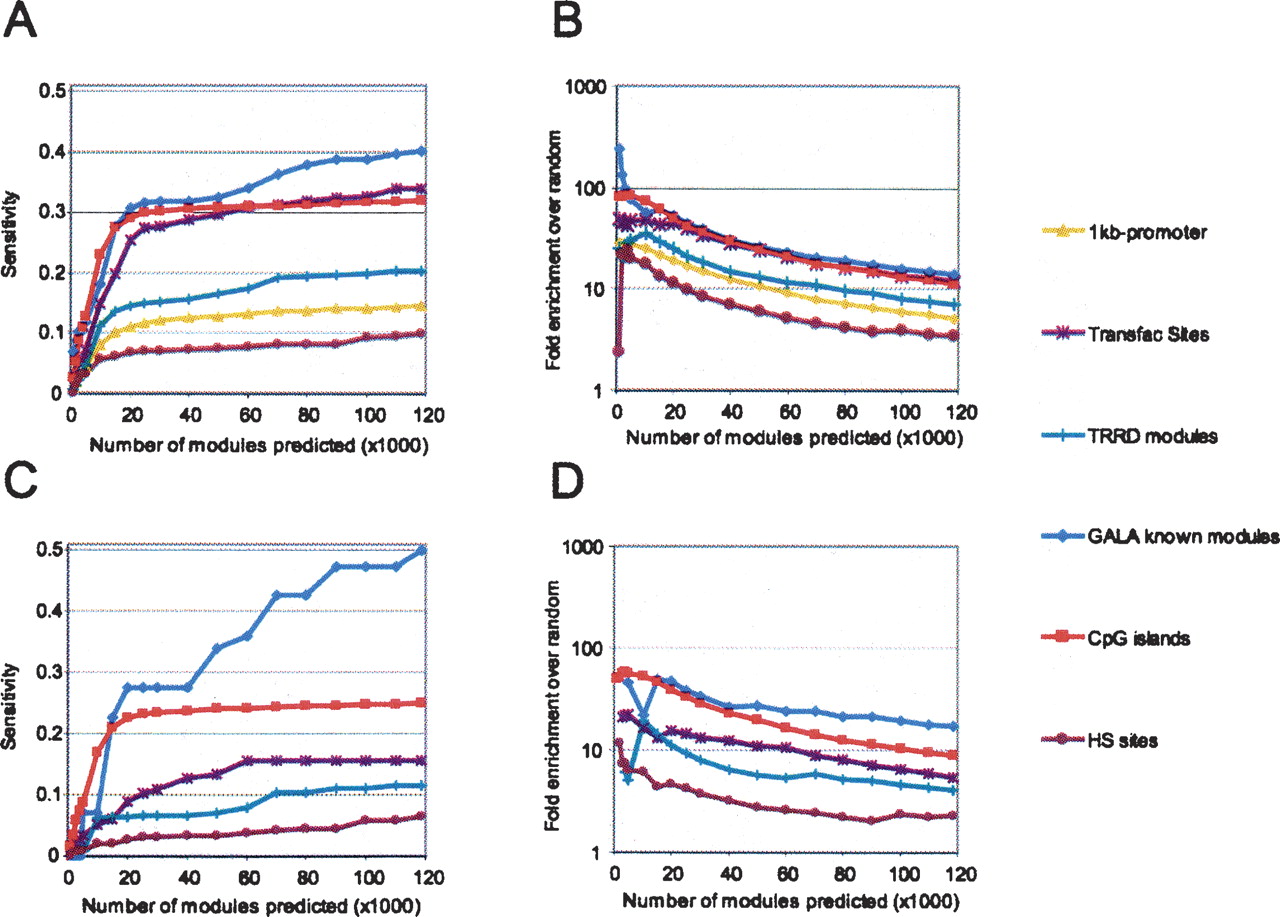
Sensitivity and enrichment of pCRMs for various regions of interest. (A) Sensitivity of the module predictions at varying score threshold, with respect to likely regulatory regions. Along the y-axis is the fraction of the bases within known regulatory regions that are predicted to belong to a pCRM. Along the x-axis is the number of predicted modules above a given threshold. Regions of interest are: 1 kb upstream: regions upstream of the TSS of Known Genes (based on the UCSC Genome Browser); Transfac sites: a set of 1209 experimentally verified binding sites from Transfac 7.2, mapped onto the human genome; TRRD modules: a set of 601 experimentally verified regulatory modules from the TRRD database; GALA modules: a set of 93 modules for the GALA database; CpG islands (based on the UCSC Genome Browser annotation); 1 kb upstream: regions upstream of the TSS of Known Genes that are not annotated as CpG islands; HS sites: a set of DNaseI hypersensitive sites from the Encode regions. (B) The fold enrichment is computed as the ratio between the size of the intersection between modules and regions of interest and the expected intersection size if modules were randomly positioned in the genome. (C,D) The analogous data, but restricting our attention to non proximal regulatory regions, i.e., those located more than 1 kb away from the TSS of the closest gene.


