
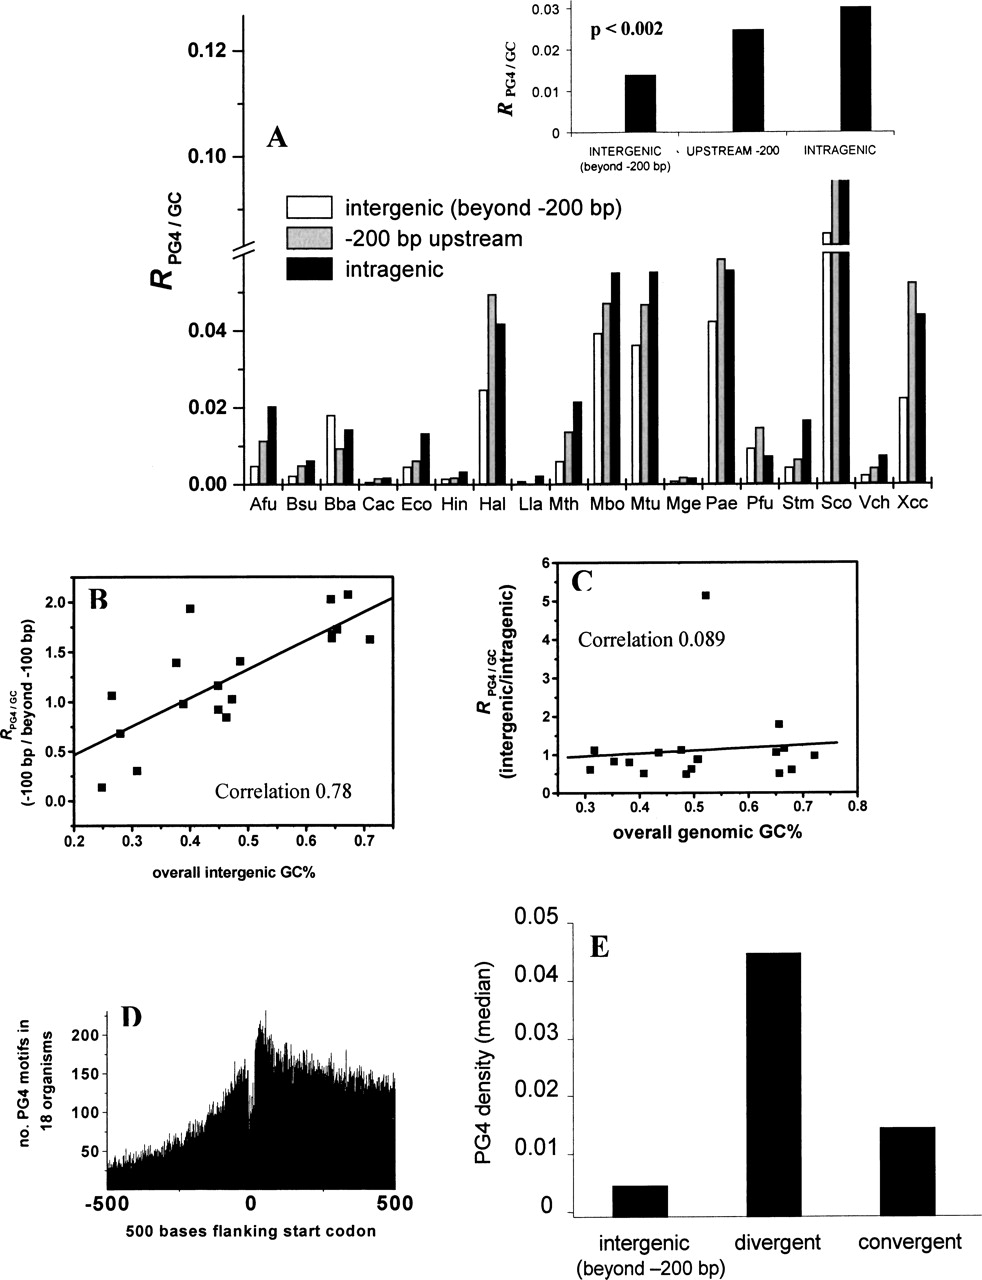
Putative regulatory regions in prokaryotes are enriched in PG4 motifs. (A) Genome-wide distribution of PG4 motifs within the + strand in 18 prokaryotes showing frequency of the bases forming PG4 motifs in each region expressed as a ratio of the GC frequency of the respective region (RPG4/GC) for each organism. (Inset) Median ratio (RPG4/GC) for each region calculated from the distribution in the respective regions across all organisms. (Supplemental Table S5 shows the mean and standard deviation, and Supplemental Fig. S3 shows a similar distribution for the − strand.) The intergenic (beyond −200 bp) region includes all intergenic regions except the downstream region between two convergently oriented genes. (B) GC-rich organisms have selected for PG4 motifs in their immediate upstream regions. Ratio of the frequency of PG4 motifs (after controlling for GC% in the respective regions) in the −100-bp region versus beyond −100 bp within the intergenic region shows a high correlation with the GC% of the intergenic region for respective organisms. (C) The motif frequency of intergenic versus intragenic regions does not depend on the GC% of the genome. The ratio-plot for intergenic versus intragenic regions against overall (genome-wide) GC% of the organism shows very low correlation. M. genitalium shows a high ratio (>5.0) because of a very low intergenic basepair length (correlation on excluding M. genitalium was 0.24). (D) The number of PG4 motifs decreases sharply on moving upstream of genes relative to the intragenic regions. Data were plotted from all 61,355 ORFs in 18 organisms within the flanking 500 bases of the start codon of all ORFs. The center of each motif sequence was used for mapping with respect to the start codon (i.e., for a sequence of length n, the n/2-th base was used as its coordinate). (E) Promoter-rich regions have a higher density of PG4 motifs. Intergenic regions separating divergently (promoter-rich) and convergently (possibly promoter-less) oriented gene pairs were mapped in all 18 organisms for comparison. The median of PG4 density (number of bases involved in motif pattern normalized for sequence length of the respective region) is shown along with the density in the intergenic regions (beyond −200 bp, as in A). The difference between the divergent and convergent (P < 0.007) and the divergent and intergenic (P < 0.025) regions was significant, while the difference between the convergent and intergenic regions was not significant (P = 0.199). All statistical comparisons were done in a pairwise mode for the different genomic regions, and significance was estimated using the two-tailed nonparametric Signed Wilcoxon Test. The organism acronyms are as obtained from KEGG and are mentioned in Methods.


