
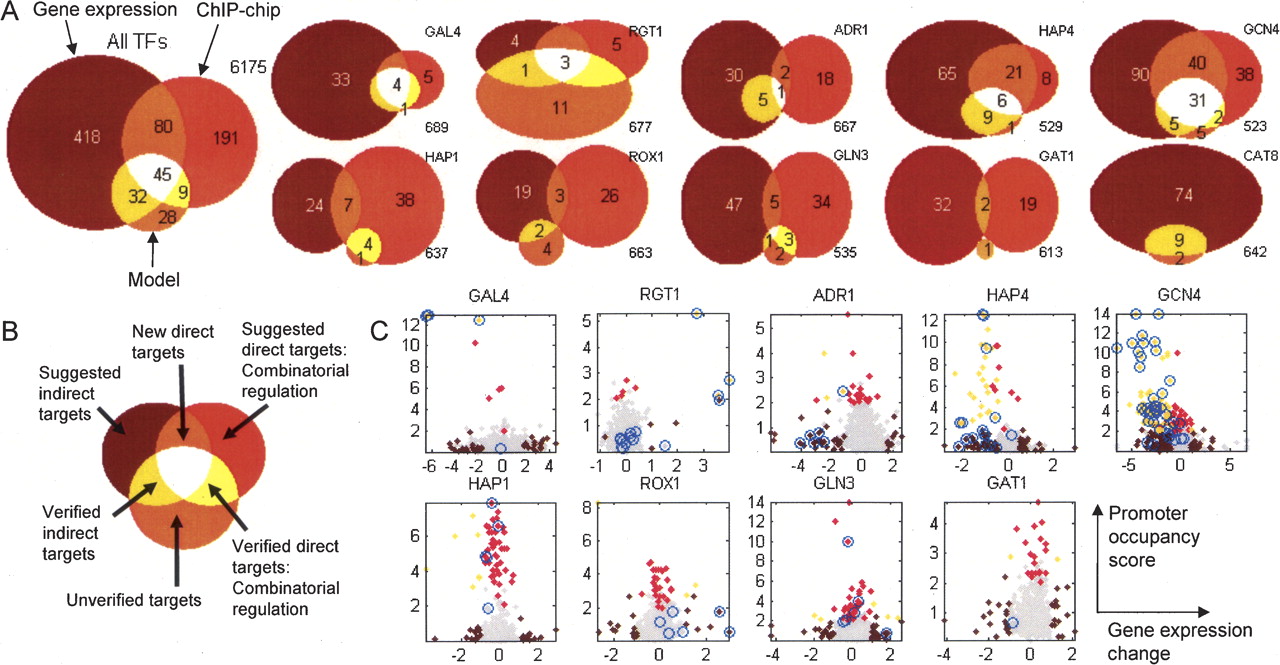
Comparison between expression changes in TF knockout and overexpression strains predicted by iMH805/775, in vivo observed expression changes, and promoter occupancy for the corresponding TFs derived from ChIP-chip and motif data. (A) Overlaps between the three data sets shown in the form of Venn diagrams. The numbers refer to the number of genes in each category out of the total of 750 metabolic genes. (B) Interpretation of each of the segments in the Venn diagrams shown in A. (C) Scatterplots of the gene expression changes in TF knockout/overexpression strains (log2 ratios between knockout strain and wild type) and the corresponding promoter occupancy scores derived from ChIP-chip data (−log10 of the P-value reported in Harbison et al. [2004). The genes that were predicted to change in expression by the iMH805/775 model are indicated by blue circles. Genes with significant gene expression change or promoter occupancy are colored using a color scheme similar to the one used in the Venn diagrams in A.


