
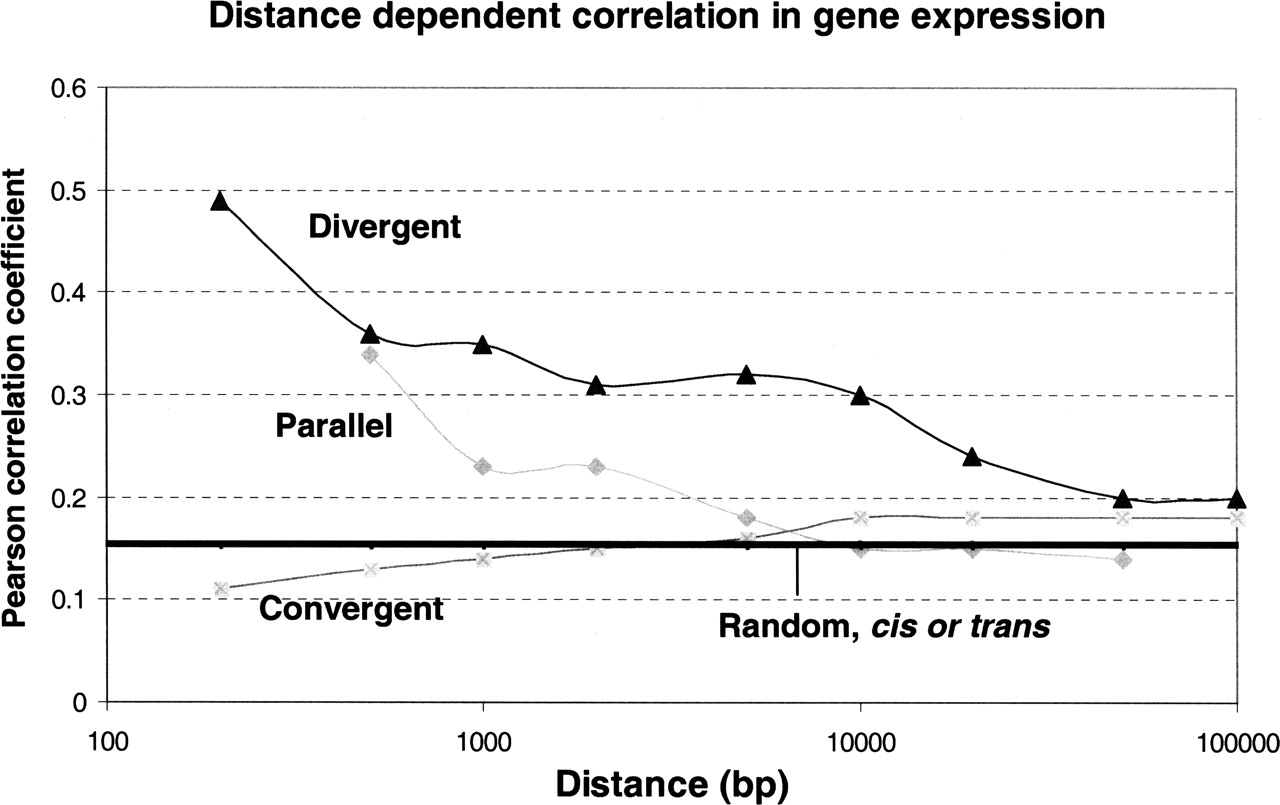
Figure 2.
Distance-dependent correlation in gene expression. x-axis is the distance between neighboring genes and y-axis is the Pearson correlation coefficient values. (Parallel) Parallel gene pairs; (Divergent) divergent neighboring gene pairs; (Convergent) convergent neighboring gene pairs. Each point in the figure represents a median value for the Pearson correlation coefficient for each group. Pearson correlation coefficient values for cis- and trans-random gene pairs are essentially the same and are represented by a horizontal line.


