
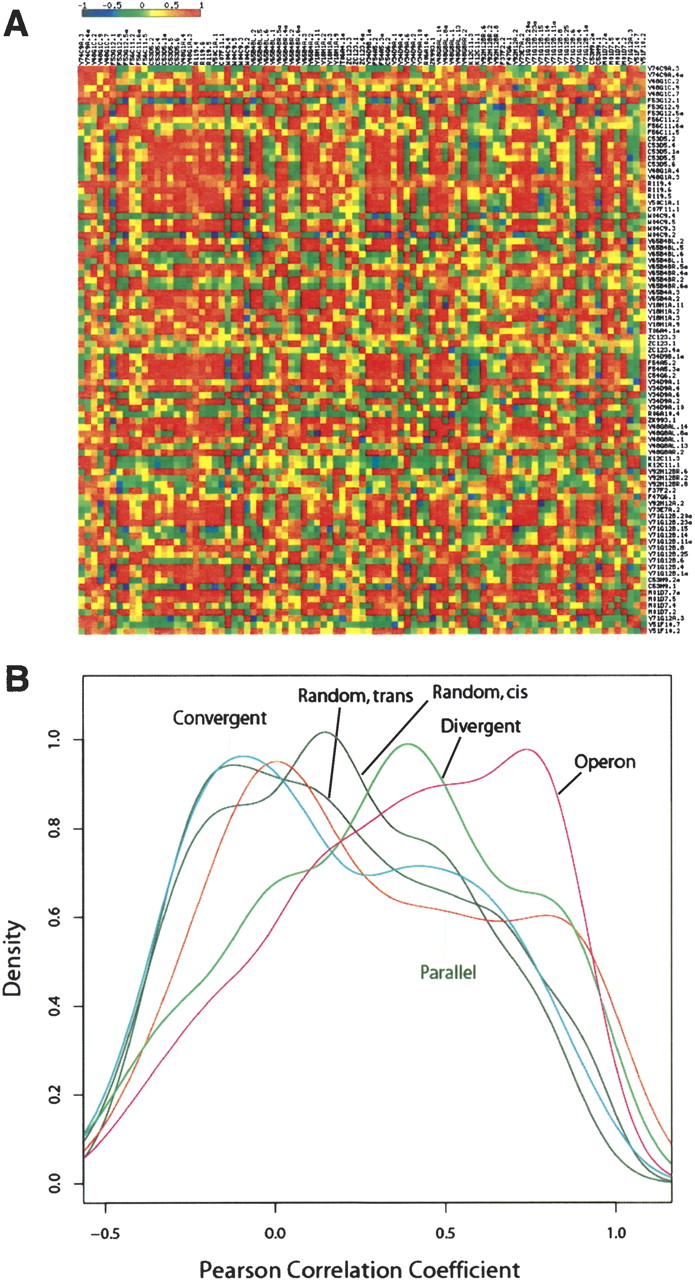
Correlation in gene expression. (A) A heat map that shows the correlation in gene expression for genes within the region 1–2 Mb on chromosome I. Each small box represents a pairwise Pearson correlation coefficient value that indicates the level of gene expression. (B) Distribution of Pearson correlation coefficient values calculated based on tissue-specific SAGE tags. (Parallel) Parallel gene pairs with distance between closest coding exons ≤1000 bp; (Divergent) divergent neighboring gene pairs with distance between closest coding exons ≤1000 bp; (Convergent) convergent neighboring gene pairs between closest coding exons ≤1000 bp; (Operon) gene pairs within operons; (Random cis) random gene pairs within same chromosomes; (Random trans) random gene pairs in which two genes are from different chromosomes.


