
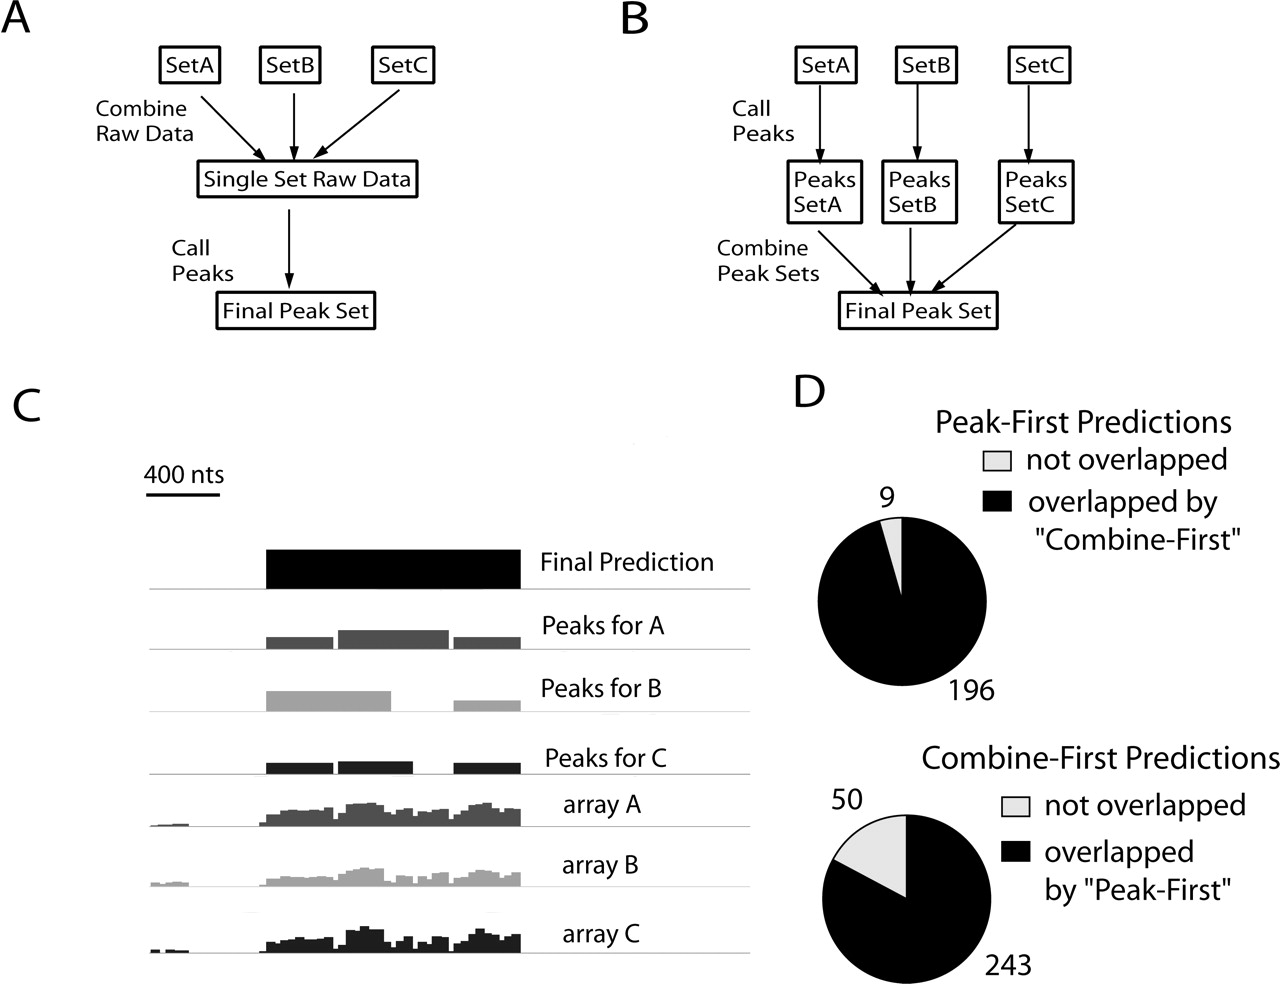
Combining array data sets. (A) A schematic illustration of the “combine-first” approach. (B) A schematic illustration of the “peak-first” approach. (C) An example of peak-calling and combination (at L1 for each array) on the same region from ENr223 from three independent arrays. The maximum bar height (log2) is 5.44 for “array A”; 2.10 for “array B”; and 4.18 for “array C”. The final derived peak is shown by the black rectangle on the top line and extends from chr6:74156406 to 74157748. All three arrays contributed significantly to the set of peaks; for the total set of 205 L1 peaks, 100 were found in all three arrays. (D) Comparison of binding site predictions (at L1) for peak-first and combine-first approaches for HeLa E2F1 data. Note that there are fewer “peak-first” predictions and that nearly all “peak-first” predictions (96%) are in the “combine-first” set. See Results and Supplemental Methods for additional description.


