
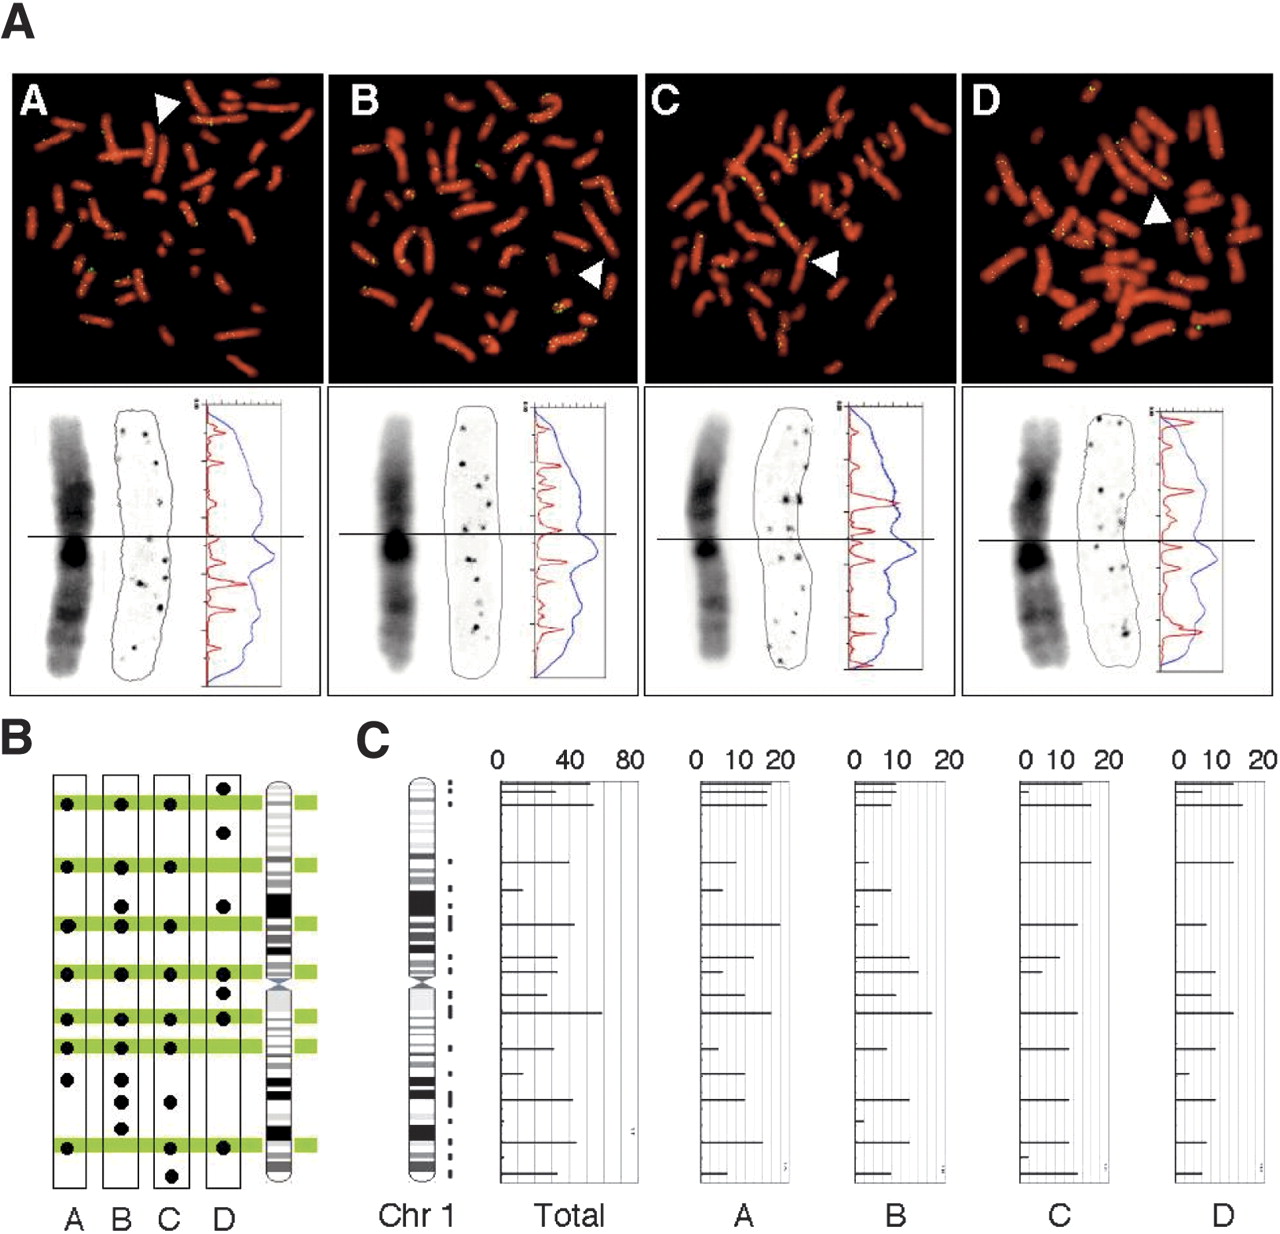
Genome-wide distribution of 8-oxoG is conserved among individuals. (A, top) Immunological detection of 8-oxoG on metaphase chromosomes from four individuals (A–D, green: immuno-fluorescence signal, red: DAPI). Arrowheads indicate a single chromosome 1. (A, bottom) High-magnification image of chromosome 1 (arrow, top). A positively inverted monochrome image of DAPI (left) and signal (middle) is presented. The fluorescence intensity of DAPI (blue) and signal (red) are plotted on the profile (vertical axis: chromosome length, horizontal axis: fluorescence intensity). (B) The position of each signal detected on chromosome 1 is indicated by a filled circle on the corresponding region in the ideogram. The regions detected in more than three chromosomal copies of the four individuals are colored. (C) Total scoring for 8-oxoG from 10 copies of chromosome 1 of the four subjects are represented as bar plots with the chromosome length on the y-axis and the 8-oxoG score on the x-axis, max = 20 points, see Methods). The vertical lines on the right of the ideogram indicate mapped regions. A bar indicating frequency per region was plotted at the center of the corresponding region.


