
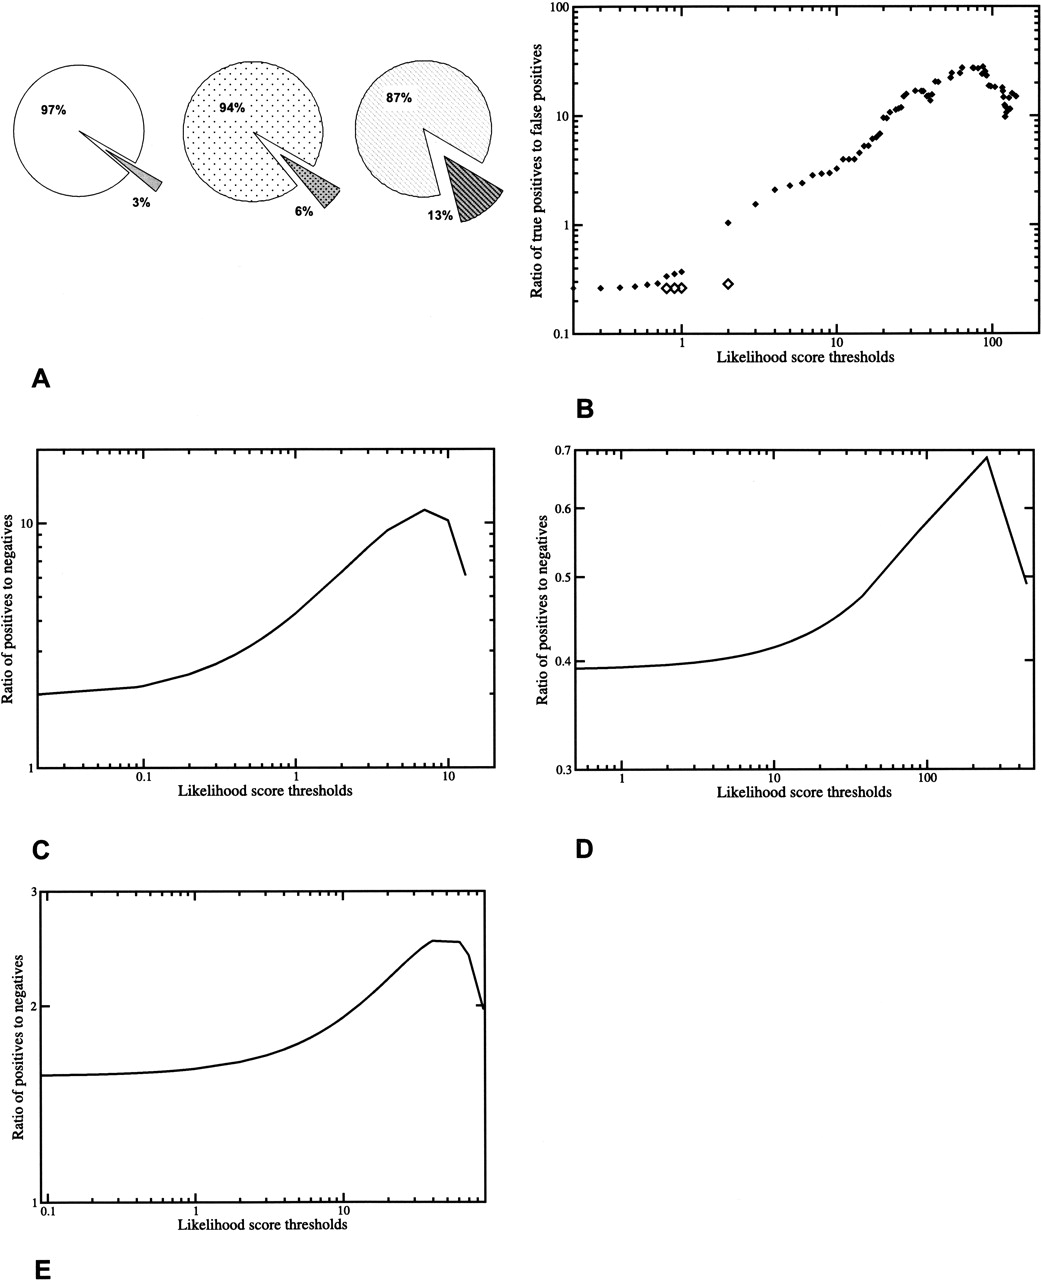
Quality of the predicted set of functional linkages and comparison with other functional genomics data sets. (A) Initial data quality was assessed using sets of randomly paired proteins (see Methods). Each graph indicates overlap between
random sets and predicted linkages; darker shades indicate false positives or overlap with random sets; (○) all possible P. falciparum pairs; ( ) proteins in network; (
 ) shuffled pairs from the map. (B) Tests using sevenfold cross-validation and comparison with likelihood scores from shuffled input data indicate the suitability
of the predicted functional linkages for inclusion in the interaction map. Likelihood scores from the shuffled sets, indicated
as (◇), are significantly lower, and show a very high percentage of false positives, attesting to the information gain when
using normal linkages. The model is robust to changing benchmarks. Similar trends are generated when tested with data generated
by Le Roch et al. (2003) (tested with 21,486 positives and 8160 negatives) (C), the M1 (tested with 267,716 positives and 699,029 negatives) (D), and M2 (tested with 191,376 positives and 129,825 negatives) (E) data sets. A line (C,D,E) represents an analytical fit to the data by least squares.
) shuffled pairs from the map. (B) Tests using sevenfold cross-validation and comparison with likelihood scores from shuffled input data indicate the suitability
of the predicted functional linkages for inclusion in the interaction map. Likelihood scores from the shuffled sets, indicated
as (◇), are significantly lower, and show a very high percentage of false positives, attesting to the information gain when
using normal linkages. The model is robust to changing benchmarks. Similar trends are generated when tested with data generated
by Le Roch et al. (2003) (tested with 21,486 positives and 8160 negatives) (C), the M1 (tested with 267,716 positives and 699,029 negatives) (D), and M2 (tested with 191,376 positives and 129,825 negatives) (E) data sets. A line (C,D,E) represents an analytical fit to the data by least squares.


