
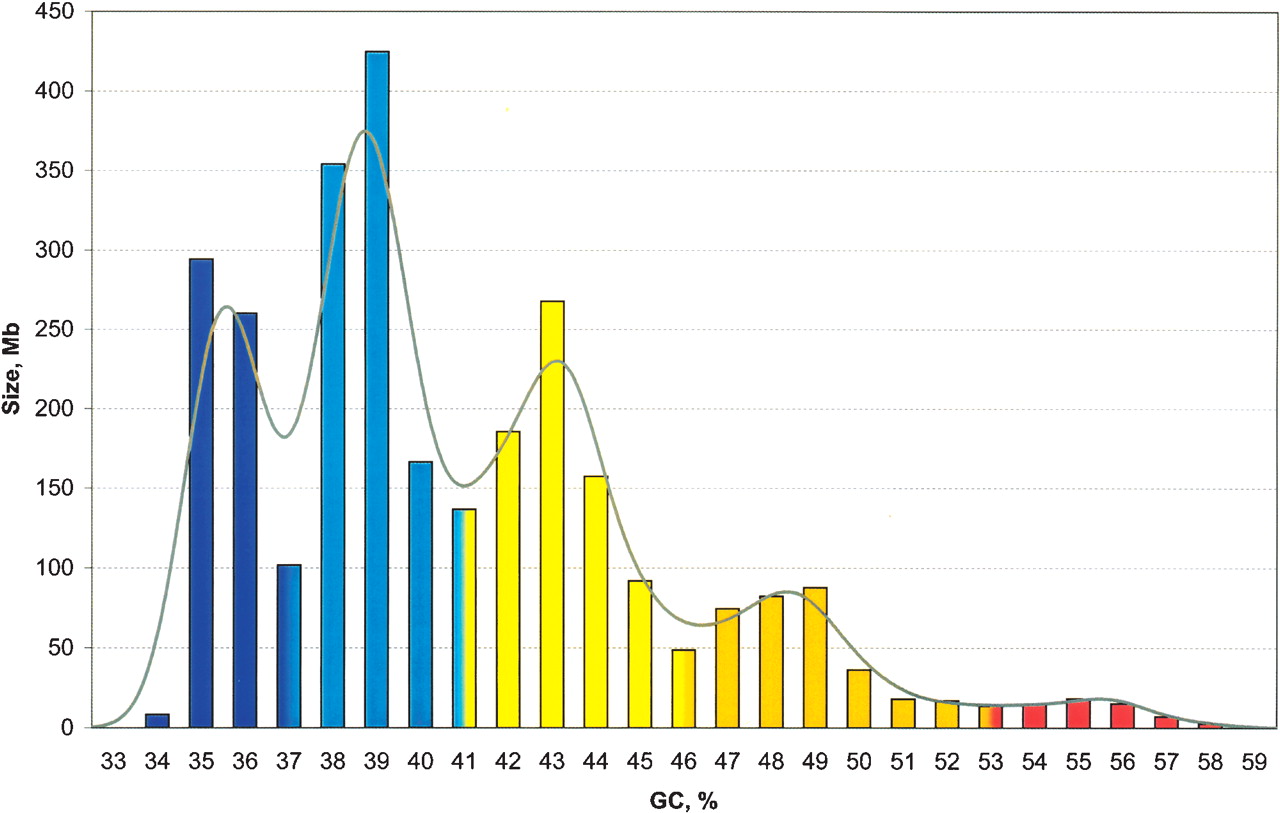
Figure 5.
Distribution of isochores according to GC levels. The histogram shows the distribution (by weight) of isochores as pooled in bins of 1% GC. Colors represent isochore families as in Figure 1. Values at minima (histogram bars with mixed colors) were split between the two neighboring families. The Gaussian profile shows the distribution of isochores as estimated directly by the “density” function in R (bandwidth 0.7% GC) (Silverman 1986).


