
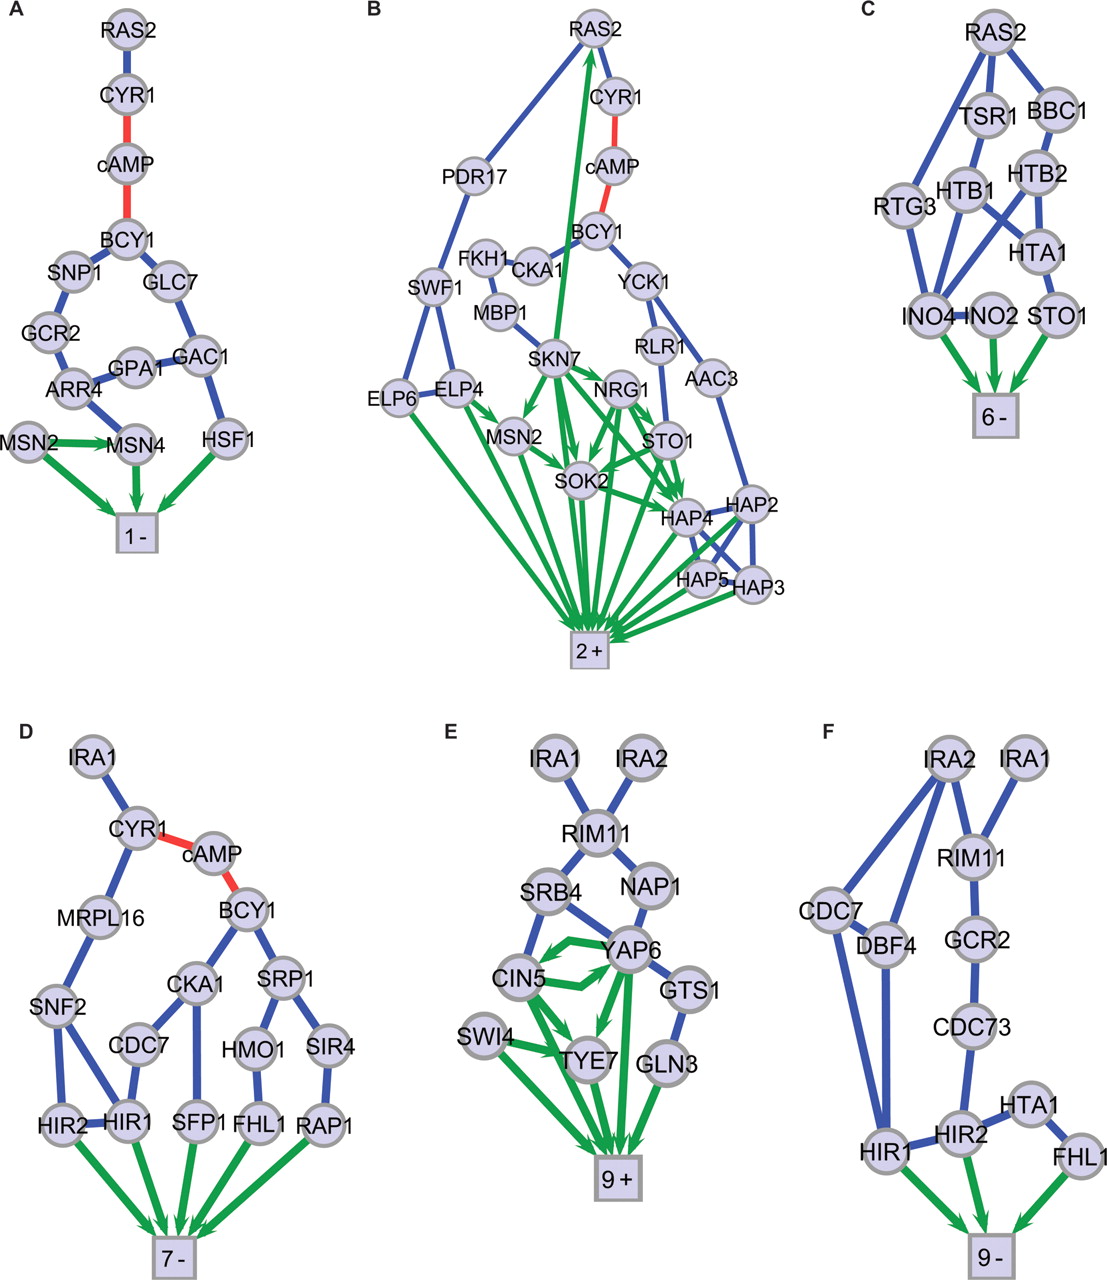
Expression-component subnetworks. Molecular interaction subnetworks are rendered for SVD gene sets with significant gene annotations and transcription factors: (A) 1-Negative, (B) 2-Positive, (C) 6-Negative, (D) 7-Negative, (E) 9-Positive, (F) 9-Negative. Four additional subnetworks for which significant gene annotations and transcription factors were found are shown in Supplemental Figure 3. The square nodes of each subnetwork represent a large number of differentially expressed genes and are labeled by mode number and positive or negative regulation. Protein–protein interaction edges are blue. Protein–DNA interactions are green directional edges. Red edges are interactions with the small molecule cAMP.


