
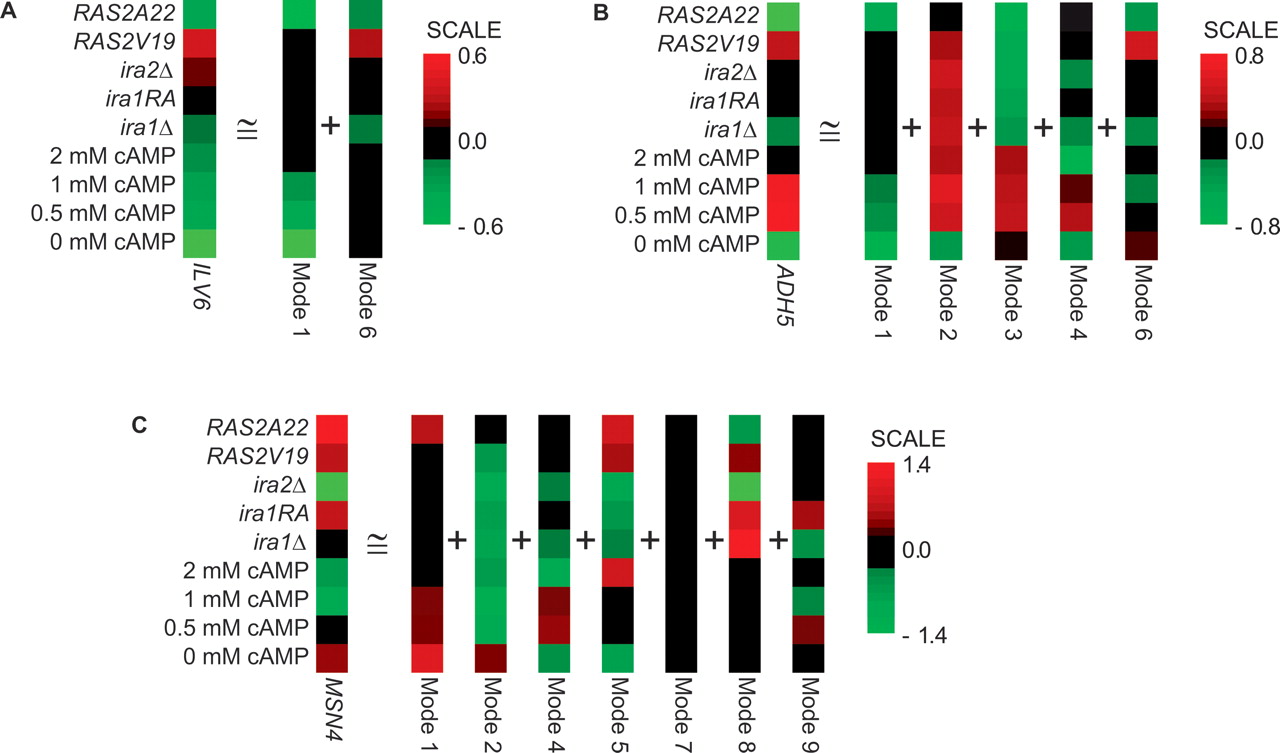
Figure 2.
Decomposition of expression patterns of individual genes. The expression pattern (left) and equivalent sum of SVD components (right) are shown for three representative genes: (A) ILV6, (B) ADH5, and (C) MSN4. Modes shown correspond to gene sets that include the gene; contributions from other modes were not significant. Raster plots are colored with red (positive), green (negative), and brightness proportional to value.


