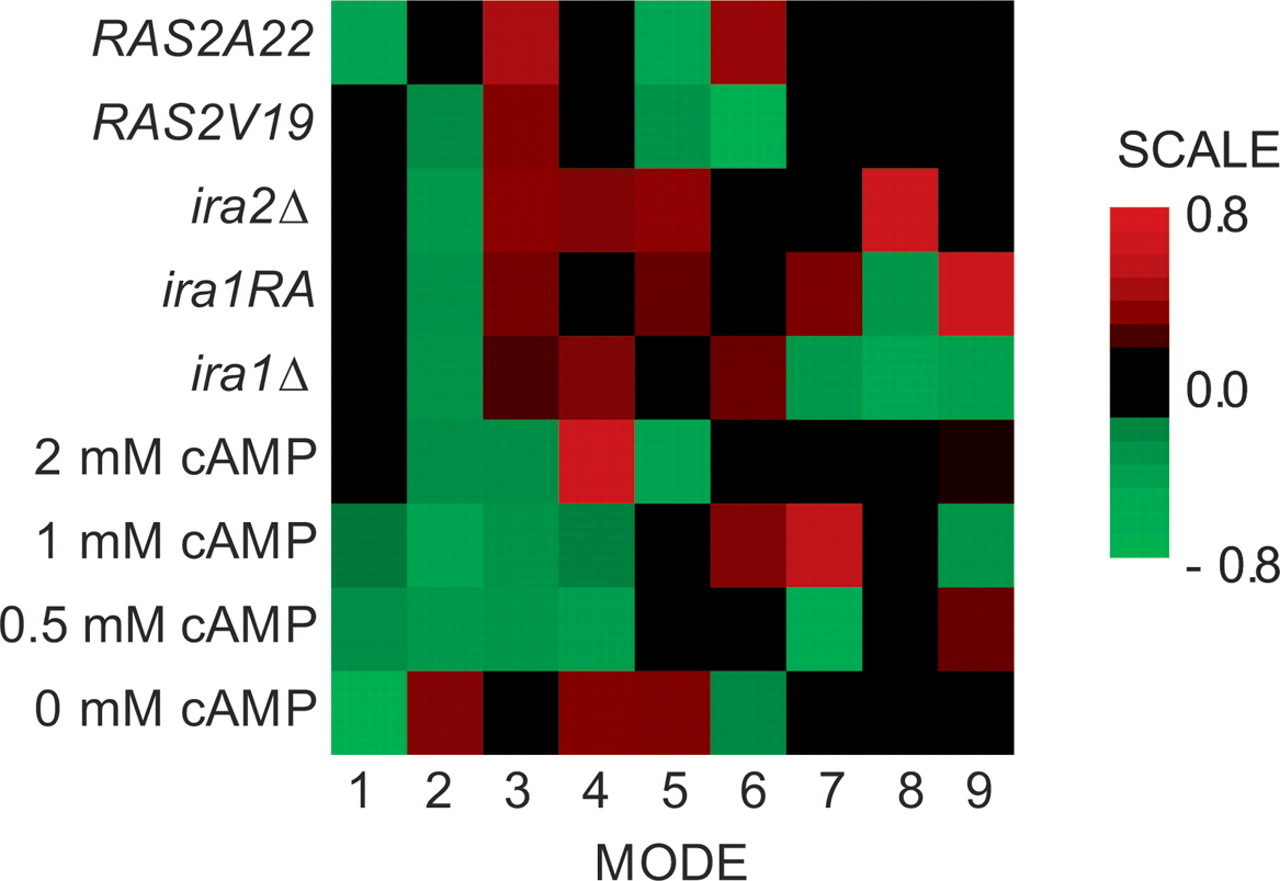
Disentangling information flow in the Ras-cAMP signaling network

(Downloading may take up to 30 seconds. If the slide opens in your browser, select File -> Save As to save it.)

Click on image to view larger version.

Figure 1.
Figure 1.

Raster plot of the SVD eigencondition matrix. The plot shows the contributions to each mode from each condition. Contributions are either positive (red) or negative (green). Greater contributions are brighter.

This Article

  1. Genome Res. 16: 520-526

Preprint Server