
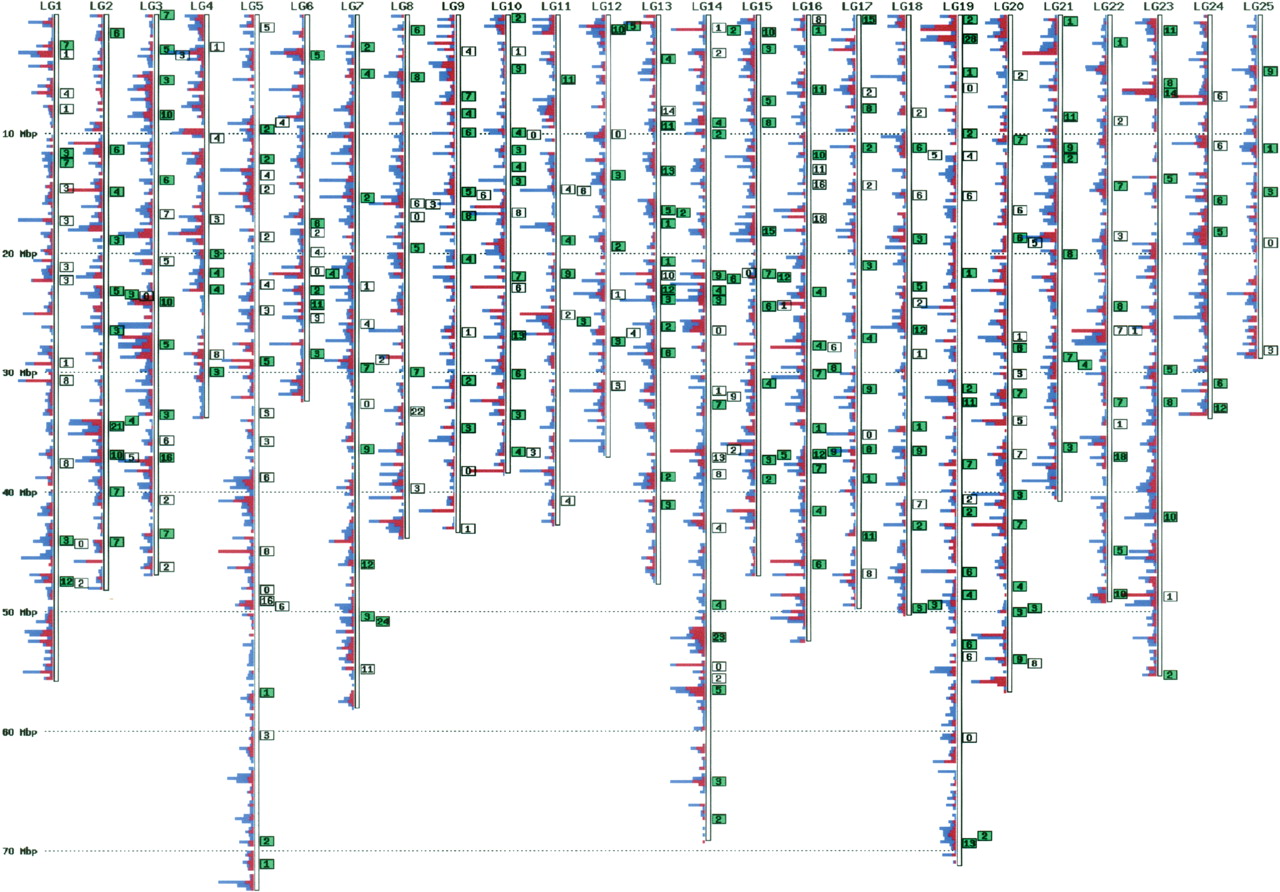
Distribution of candidate and verified SNPs on zebrafish physical map (working draft genome assembly Zv5). Vertical bars represent zebrafish linkage groups; horizontal bars on left side of each linkage group show candidate SNP density given in red for coding and in blue for noncoding candidates (according to Ensembl genome annotation 35.5b, window size 280 kbp). The filled and open boxes to the right of the linkage group correspond to amplicons with confirmed and nonconfirmed candidate SNPs, respectively. The number in each box indicates the total number of confirmed polymorphisms in each amplicon. Genotype information and oligonucleotide primers are available from http://cascad.niob.knaw.nl/snpview.


