
Figure 4.
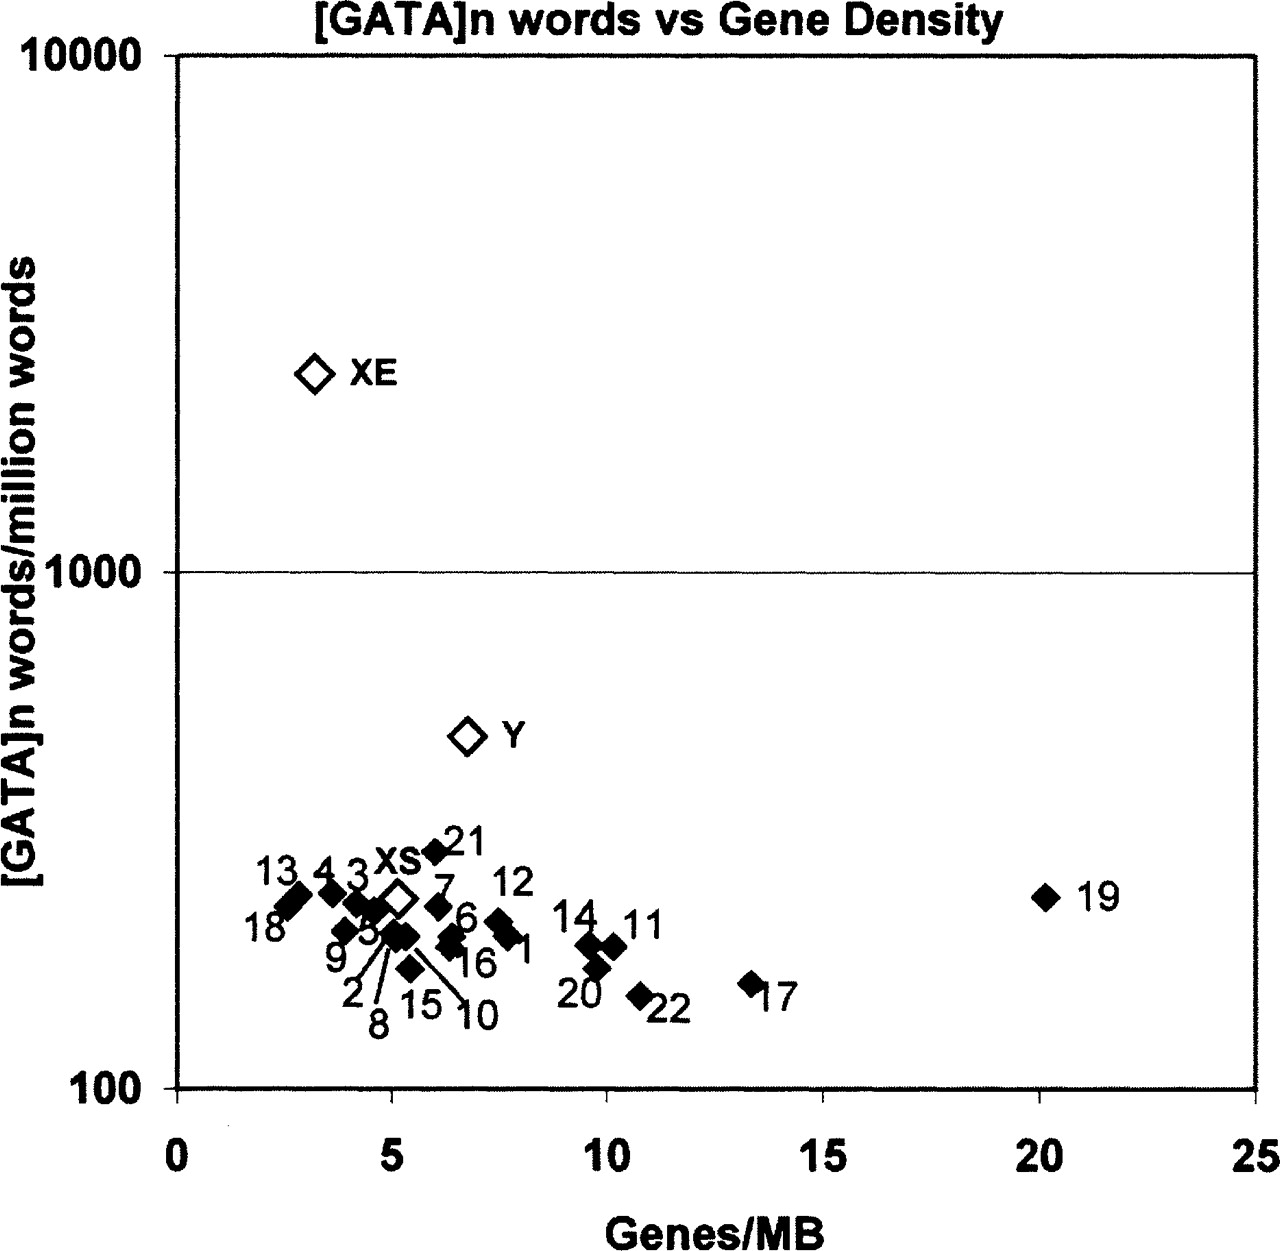
Scatter plot of [GATA]n-derived word density vs. gene density for each chromosome.
(Downloading may take up to 30 seconds. If the slide opens in your browser, select File -> Save As to save it.)
Click on image to view larger version.
Scatter plot of [GATA]n-derived word density vs. gene density for each chromosome.
 CiteULike
 Delicious
 Digg
Digg Facebook
 Google+
 Reddit
 Twitter
