
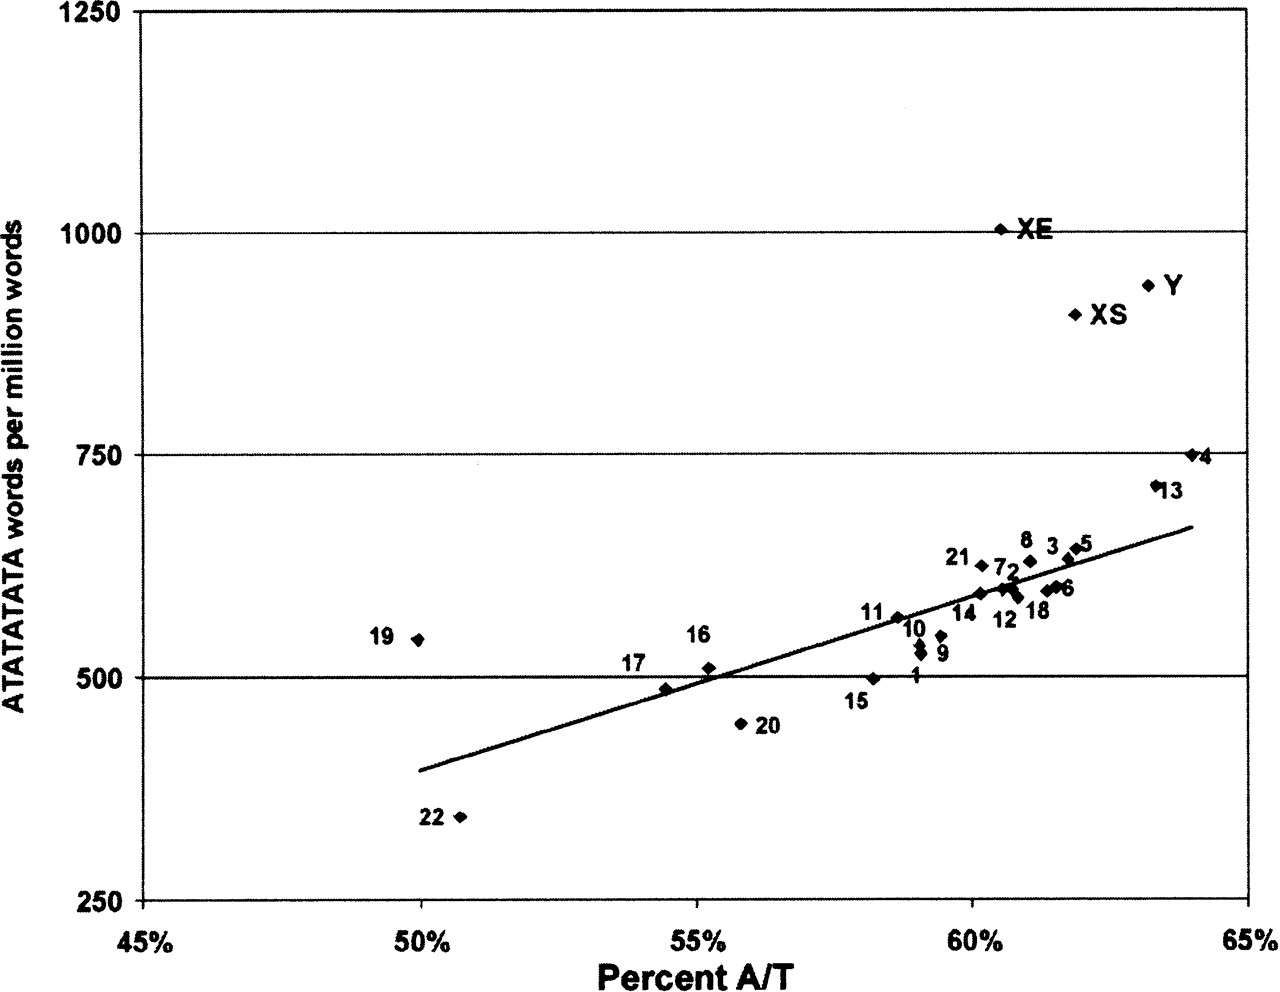
Figure 2.
The density of ATATATATA on chromosomes relative to A/T content. While there is a correlation between [AT]n word density and A/T content (trendline is a linear regression of autosomal values), the enriched [AT]n density on both XE and XS make chromosome X a clear outlier, and chromosome Y as well. The same holds true for the relationship between [AT]n density and gene density.


