
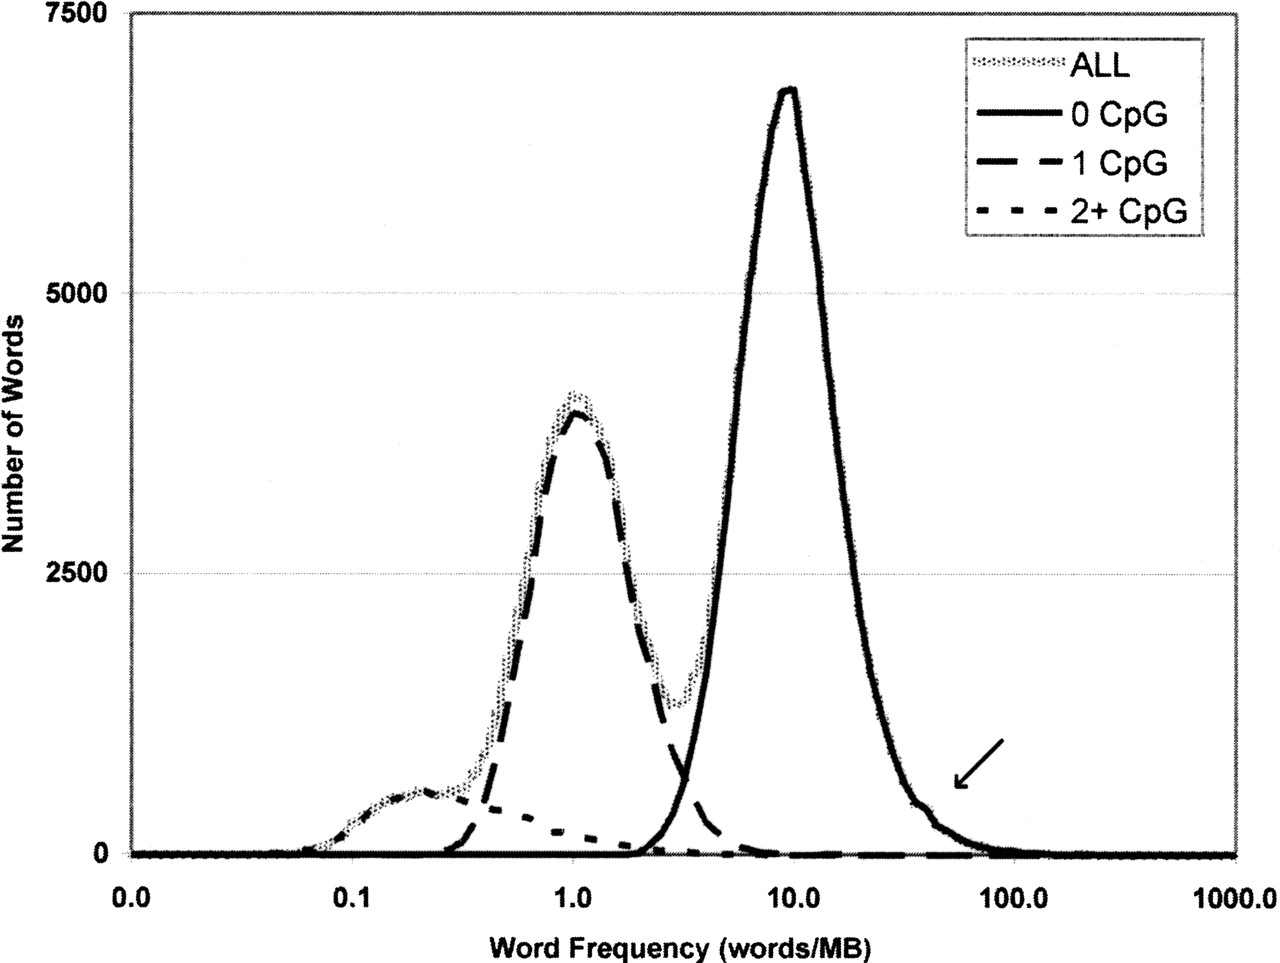
Figure 1.
Distribution of word frequencies in the genome. The x-axis represents the frequency of word pairs in the genome, and the y-axis is the number of word pairs that occur at that frequency. The highest peak is largely populated by complex words that contain no CpGs. Words containing two and one CpGs, respectively, populate the first two peaks. The rarest words in the left tail have three or four CpGs, while the shoulder on the right tail is composed of simple sequence, largely mono- and dinucleotide repeats (see arrow).


