
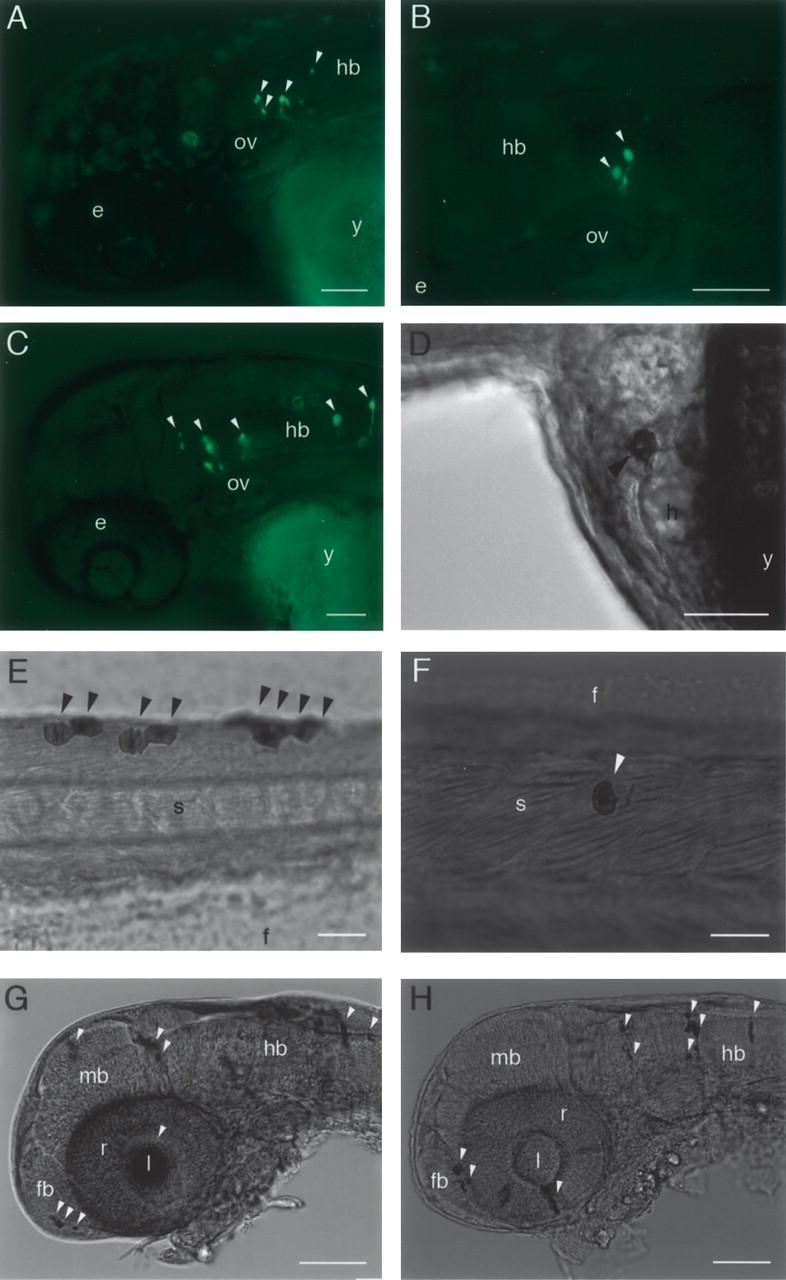
Up-regulation of GFP expression by dCNEs. GFP expression is shown in live embryos as fluorescent images (A,B,C) or in fixed tissue following whole-mount anti-GFP immunostaining (D–H). All embryos are 48–54 hpf. Lateral views, anterior to the left, dorsal to the top. GFP expression is shown in the following tissue or cell types, indicated by arrowheads: (A) 464_1, FOXP1; hindbrain; (B) 464_2, FOXP2; hindbrain; (C) dCNE 144_1, SOX14; hindbrain; (D) 144_2, SOX21; heart; (E) 484_2, SOX2; epidermal cells; (F) 484_1, SOX3; epidermal cells; (G) 146_1, ZIC2; lens and various neurons in the fore-, mid-, and hindbrain; (H) 146_2, ZIC3; retina and various neurons in the fore- and hindbrain. Scale bar 50 μm (A–D,G,H) or 100 μm (E,F). (e) Eye; (f) fin; (fb) forebrain; (h) heart; (hb) hindbrain; (l) lens; (mb) midbrain; (ov) otic vesicle; (r), retina; (s) somite; (y) yolk.


