
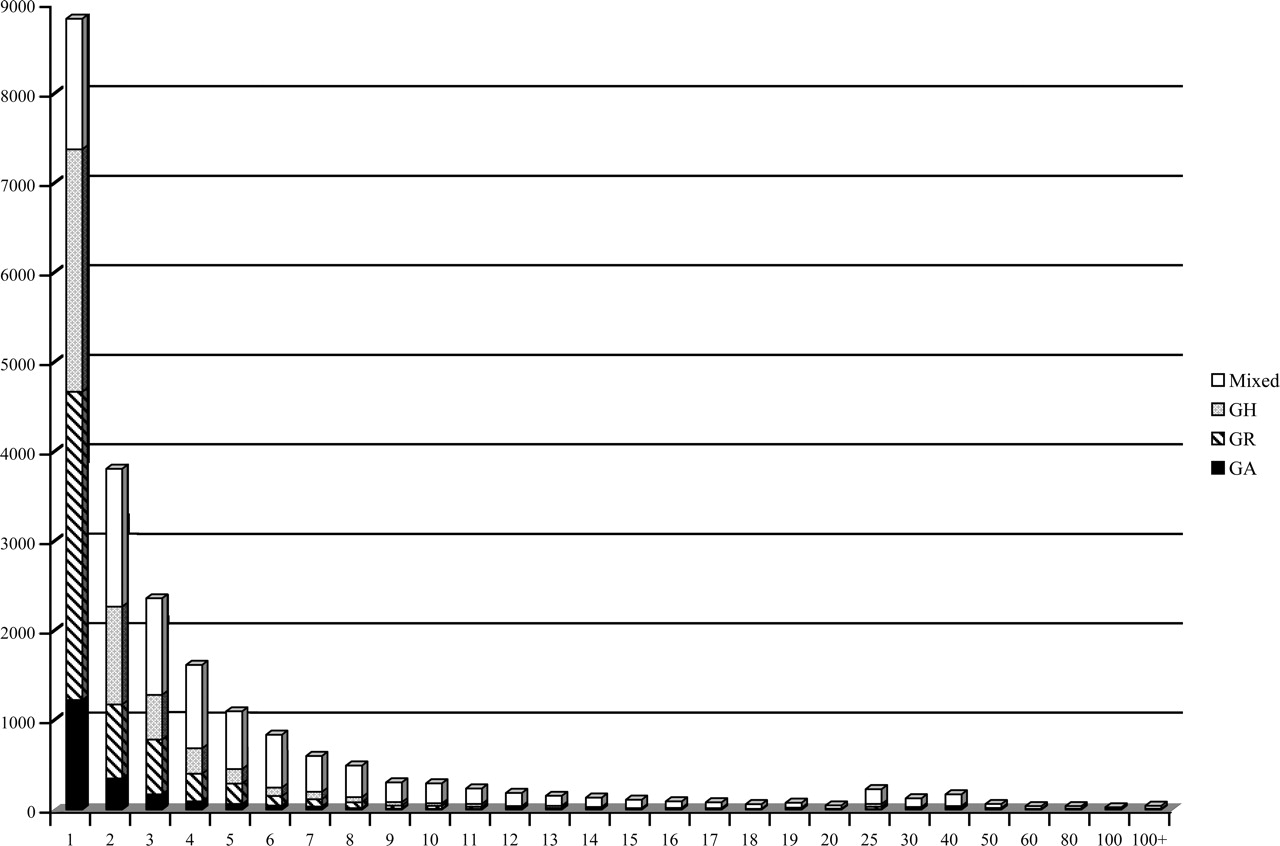
Figure 1.
Histogram of number of EST members in a contig. Different patterns and shading of the bars indicate contigs composed of ESTs from a single species and those derived from ESTs from more than one species. Contigs with more than 100 EST members are not illustrated.


