
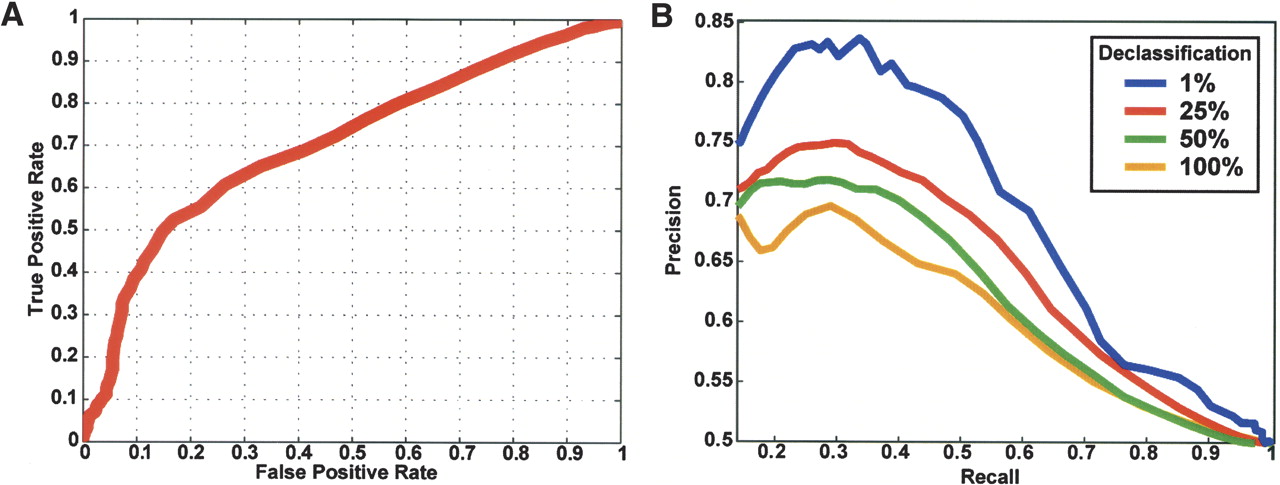
Figure 3.
(A) Estimated accuracy of the method. The Receiver Operating Characteristic (ROC) curve shows the true-positive rate (percentage of true data predicted correctly as positive) vs. the false-positive rate (percentage of false data predicted incorrectly, i.e., positive) of the method. (B) Dependence of predictions on number of available training examples. Percentage precision (percentage of positive predictions that were correct) vs. recall (true-positive rate) is plotted as the probability cutoff ranges from [0–1]. Different color plots correspond to different percents of declassification of training examples.


