
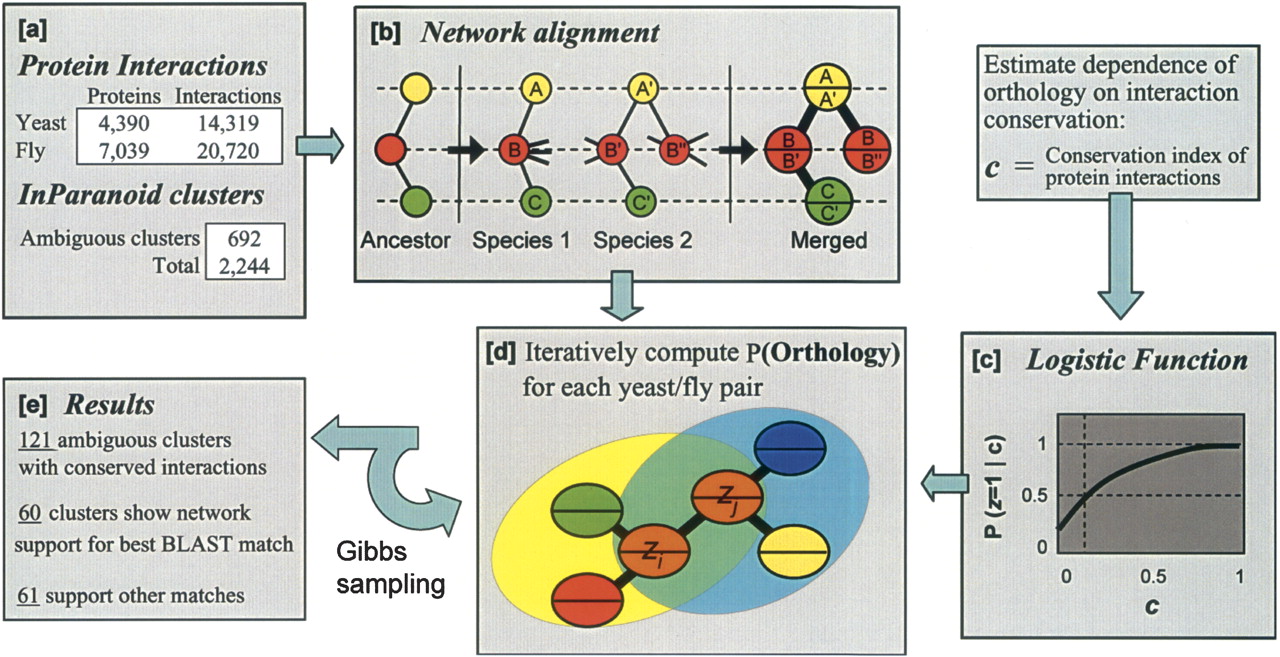
Overview of the method. (a) Protein–protein interaction networks for yeast and fly are combined with clusters of orthologous yeast and fly protein sequences as determined by the Inparanoid algorithm. (b) Networks are aligned into a merged graph representation. In this example, a gene duplication results in two proteins B′ and B″ in species 2 that are orthologous to protein B in species 1. One of these proteins may experience a gain and/or loss of interactions to enable new functional roles (Wagner 2003); however, only conserved interactions are represented in the alignment graph. (c) The logistic function shown in Figure 1B is used to compute the probability of functional orthology for a protein pair given the states of functional orthology for its network neighbors. (d) This probability is updated for each pair over successive iterations of Gibbs sampling. (e) The final probabilities confirm 60 of the best BLAST match pairings. The network supports a different hypothesis for 61 pairings.


