
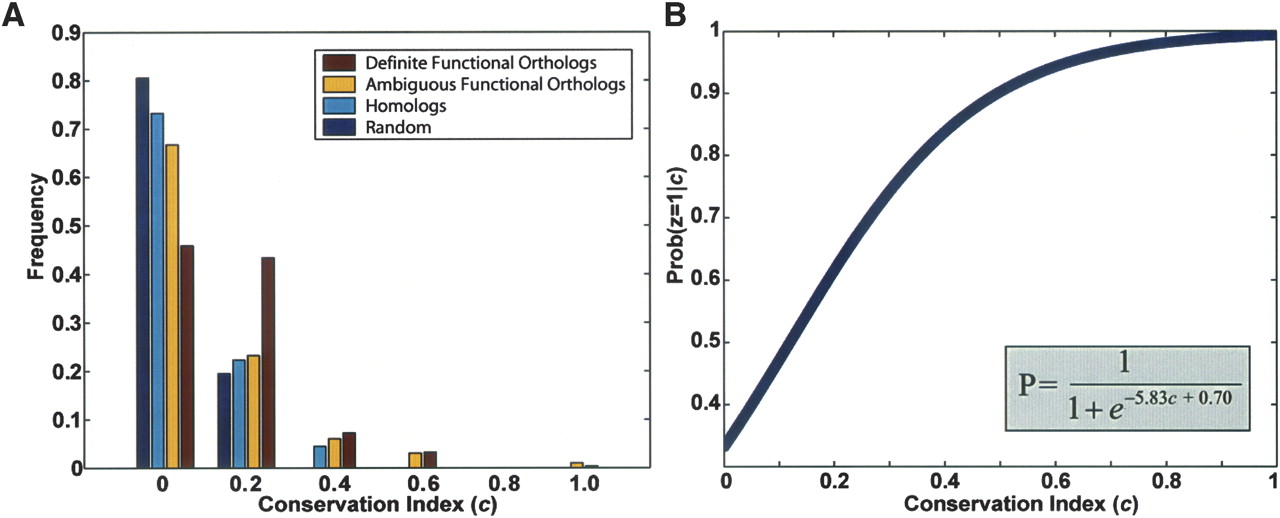
(A) Network neighborhood conservation for definite orthologs vs. other yeast/fly protein pairs. The distribution of the conservation index “c” is shown for definite functional orthologs (sole members of an Inparanoid cluster), ambiguous functional orthologs (in a cluster with multiple members), homologs (different clusters but similar sequences), and random protein pairs. Definite functional orthologs show a shift toward higher conservation of protein interactions between the yeast and fly protein networks. Mean c = 0.1512, 0.1171, 0.0870, 0.0615 for definite functional orthologs, ambiguous functional orthologs, homologs, and random pairs, respectively. (B) Logistic function relating conservation index to probability of functional orthology. Logistic regression was performed by using the “definite functional ortholog” and “homolog” pairs as positive vs. negative training data, respectively. The resulting function is shown.


