
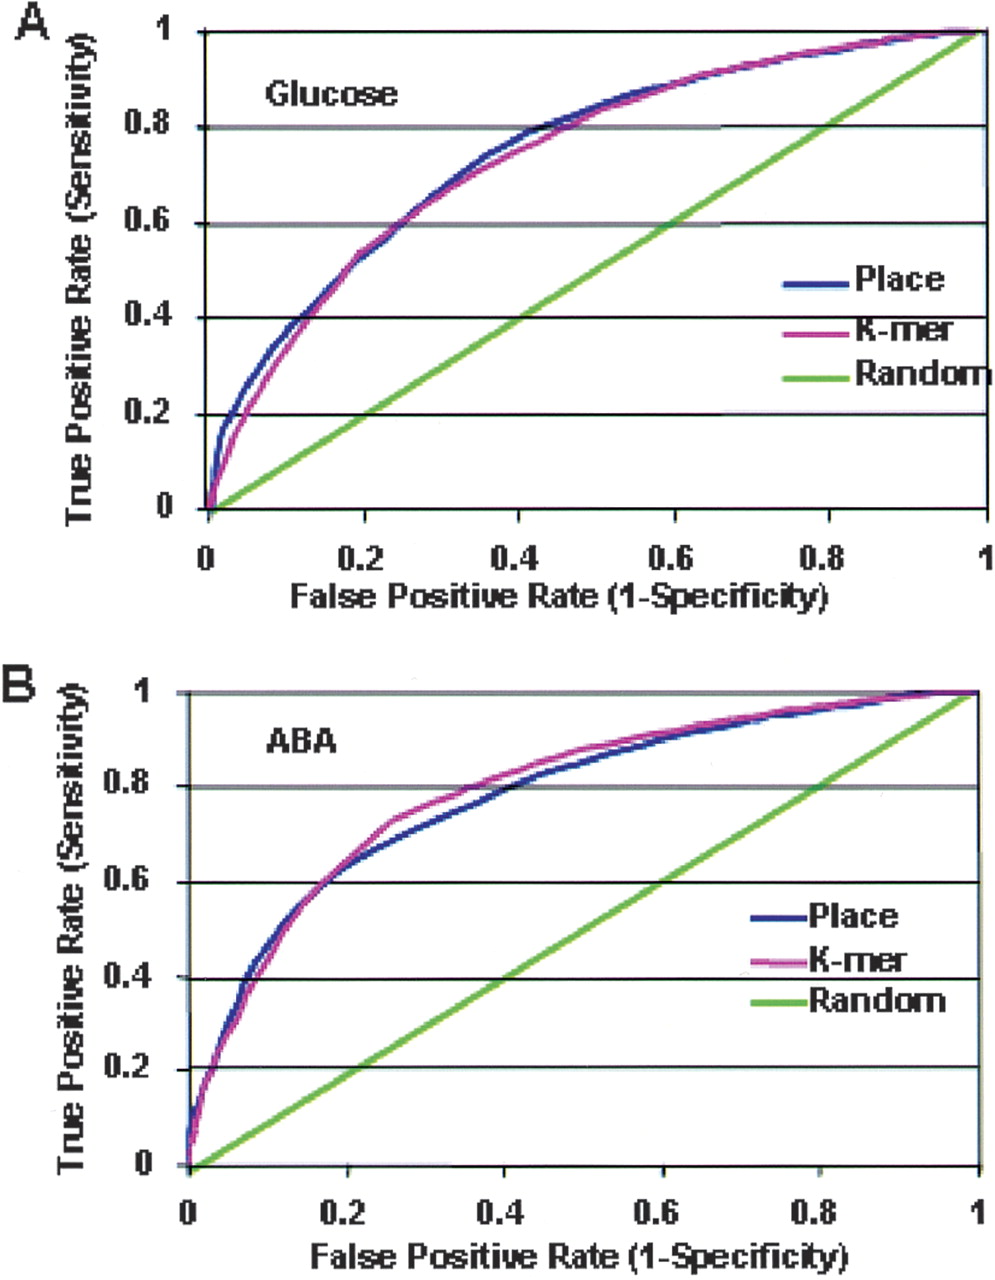
ROC (Receiver Operating Characteristic) curves of RVM performance in classifying glucose- and ABA-regulated genes. (A) The ROC curves of glucose-regulated genes show the proportion of true positives selected by the RVM versus false positives. The performance is shown by the area under the ROC curve. PLACE element features (blue line) and k-mer features (pink line). A random selection is shown by the green line. (B) The ROC curves of ABA-up-regulated genes show the proportion of true positives selected by the RVM versus false positives. The performance is shown by the area under the ROC curve. PLACE element features (blue line) and k-mer features (pink line). A random selection is shown by the green line.


