
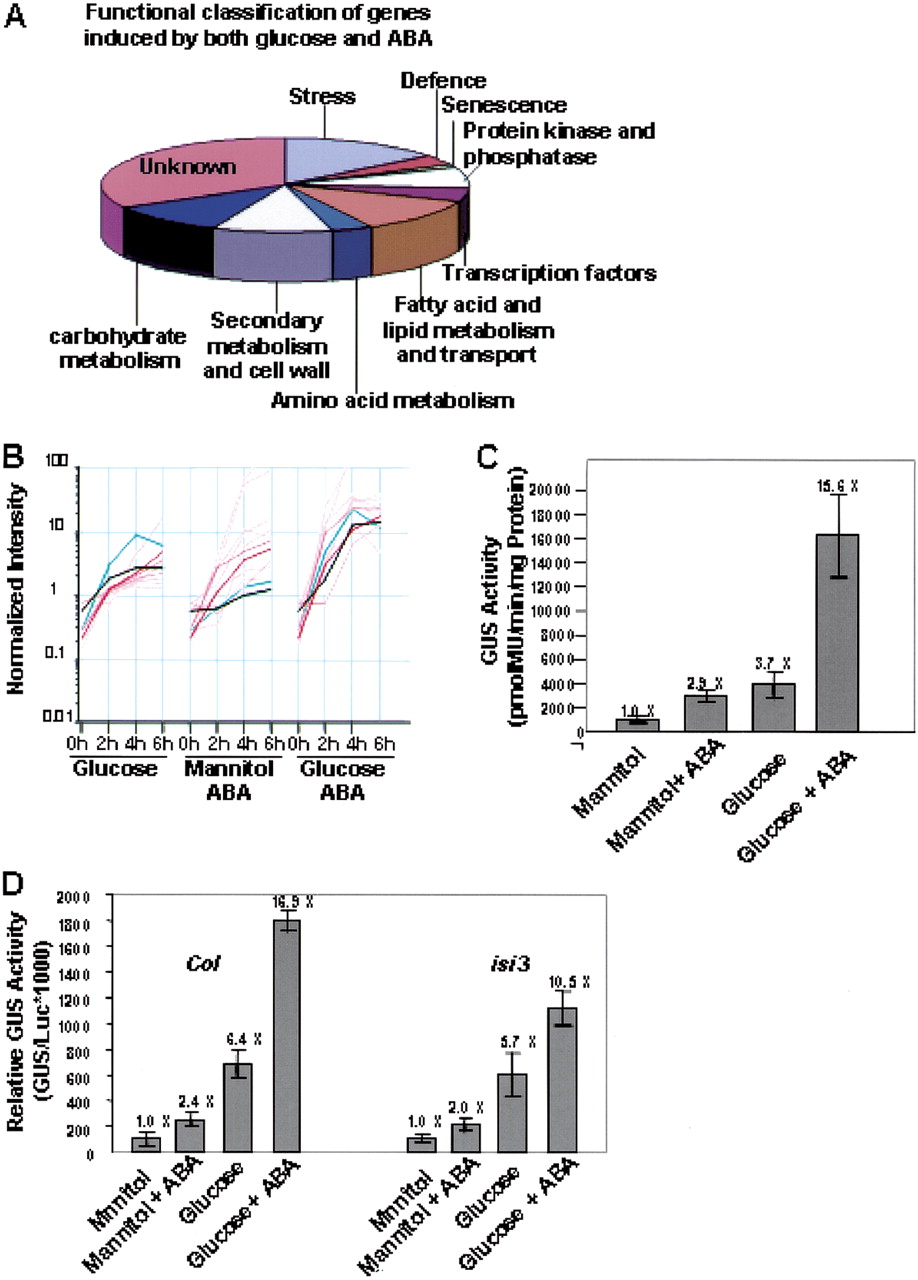
Glucose- and ABA-coregulated genes. (A) Functional classification of genes induced by both glucose and ABA. (B) Expression patterns of the set of 12 genes showing synergistic transcriptional responses to glucose and ABA. Expression patterns of the two genes encoding large subunits of AGPase (APL3 and AT2g21590) in response to glucose and ABA were indicated with a green line and black line, respectively. (C) Transcriptional responses of APL3:GUS promoter fusions to sugar and ABA in stable Arabidopsis transformants. Samples were taken from 7-d-old seedlings grown on the following media: 10 mM glucose + 90 mM mannitol (Mannitol), 100 mM glucose (Glucose), 10 mM glucose + 90 mM mannitol + 0.1 μM ABA (Mannitol + ABA), and 100 mM glucose + ABA (Glucose + ABA). The fold induction compared with the osmotic control (Mannitol) is given. Error bars represent the standard error from 10 independent transformants. (D) Response of the APL3 promoter to sugar and ABA in Arabidopsis protoplasts. Protoplasts were made from Col or isi3 7-d-old seedlings. Protoplasts were cultured in the following media: 400 mM mannitol, 400 mM glucose, 400 mM mannitol + 10 μM ABA and 400 mM glucose + 10 μM ABA. GUS activity was measured and normalized to Luciferase (Luc) activity expressed from the CaMV 35S promoter. The fold induction compared with the osmotic control of each genotype are given. Error bars represent the standard error of the mean from three samples.


