
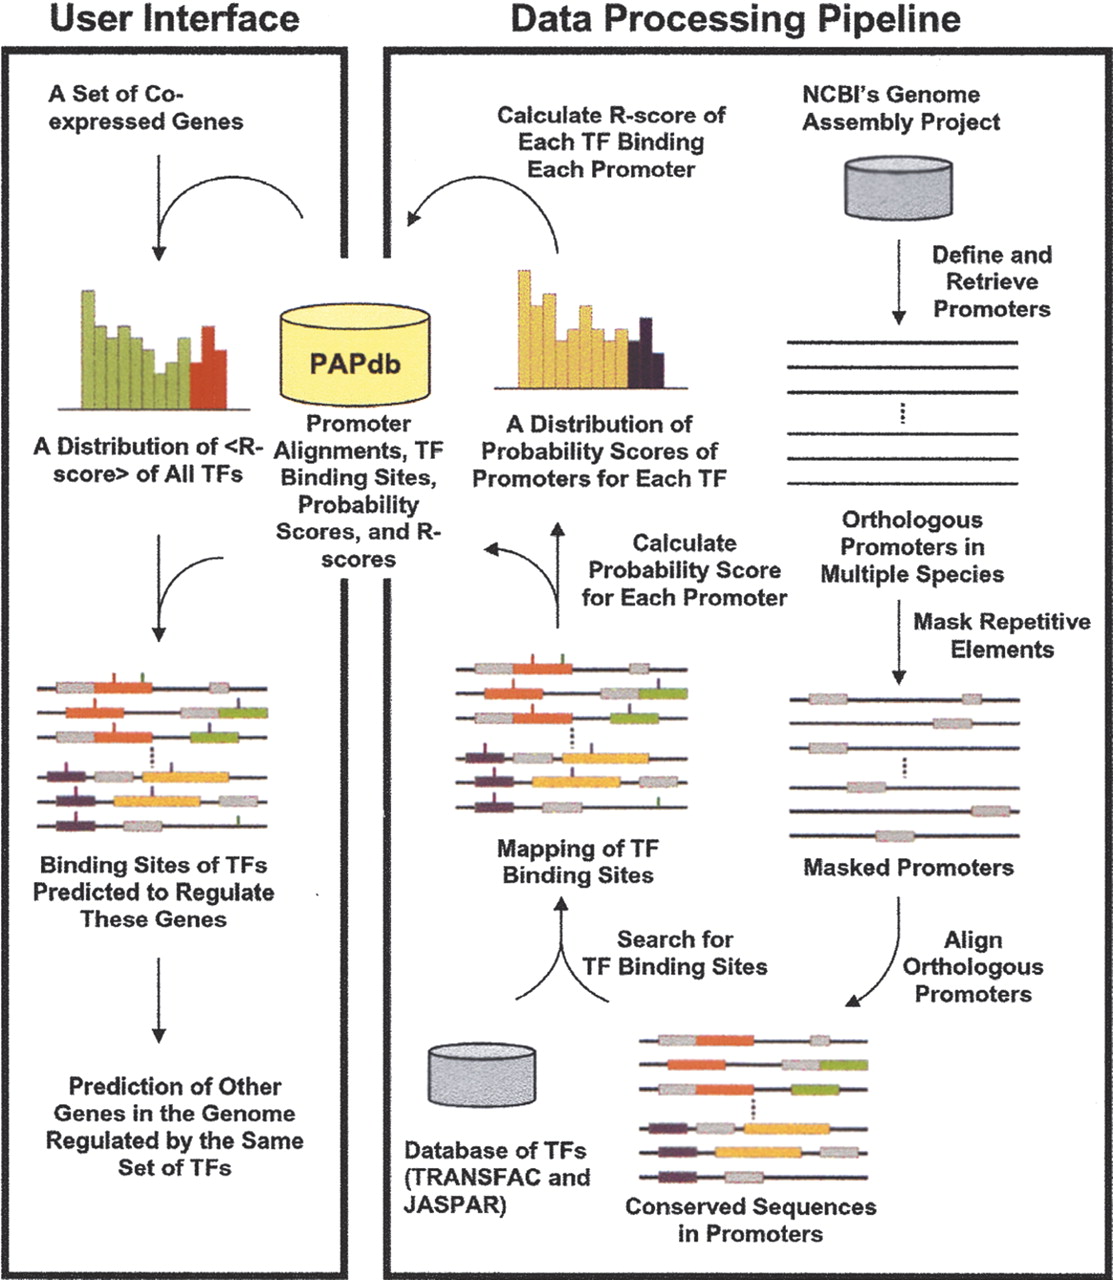
An overview of the Promoter Analysis Pipeline (PAP). PAP has two components. The data processing pipeline assembles a set of algorithms to generate the results of a genome-wide promoter analysis, whereas the user interface queries and processes the stored data according to the user's input. Promoters were acquired and repetitive elements in the promoters were masked. Promoters of orthologous genes were aligned and transcription factor (TF) binding sites were identified and mapped. Probability scores of each promoter and each transcription factor were calculated, and a distribution of probability scores was generated for each transcription factor. R-scores were then computed using these distributions. All of these results were stored in a database termed PAPdb, which was used to predict the TFs that are most likely to regulate a set of genes and the genes most likely regulated by a set of TFs.


