
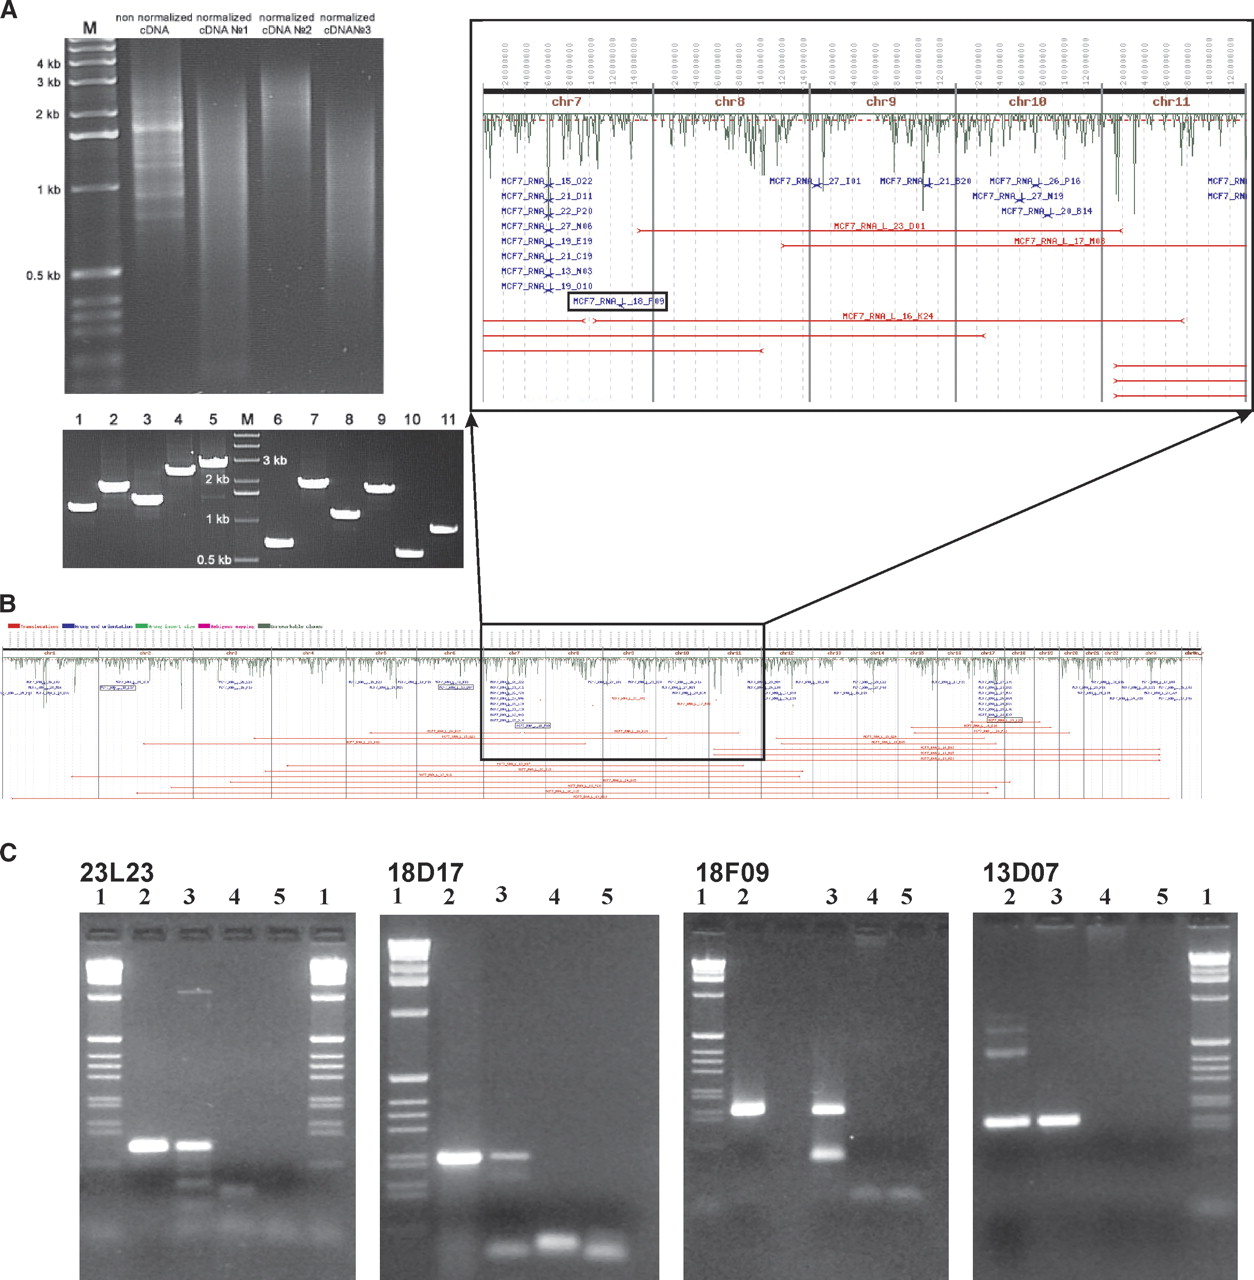
Analysis of the MCF-7 cDNA library and transcript ESP. (A) The results of normalization of the MCF-7 cDNA (top) and of PCR-based sizing of 11 randomly selected cDNA clones (bottom). (B) The results of the ESP analysis of 5000 end-sequenced cDNA clones. See Figure 1 for the detailed description of this panel with four validated clones boxed. (C) The results of the PCR validation of these clones on two independent preparations of MCF-7 cDNA using clone-specific primers spanning breakpoints (Table 1). In each panel, lane 1 is the 1-kb ladder (GIBCO-BRL); lane 2 is clone DNA; lane 3 is independent preparation of MCF-7 cDNA; lane 4 is normal breast cDNA (Stratagene adult human female, breast first strand cDNA cat# 780602); lane 5 is negative control.


