
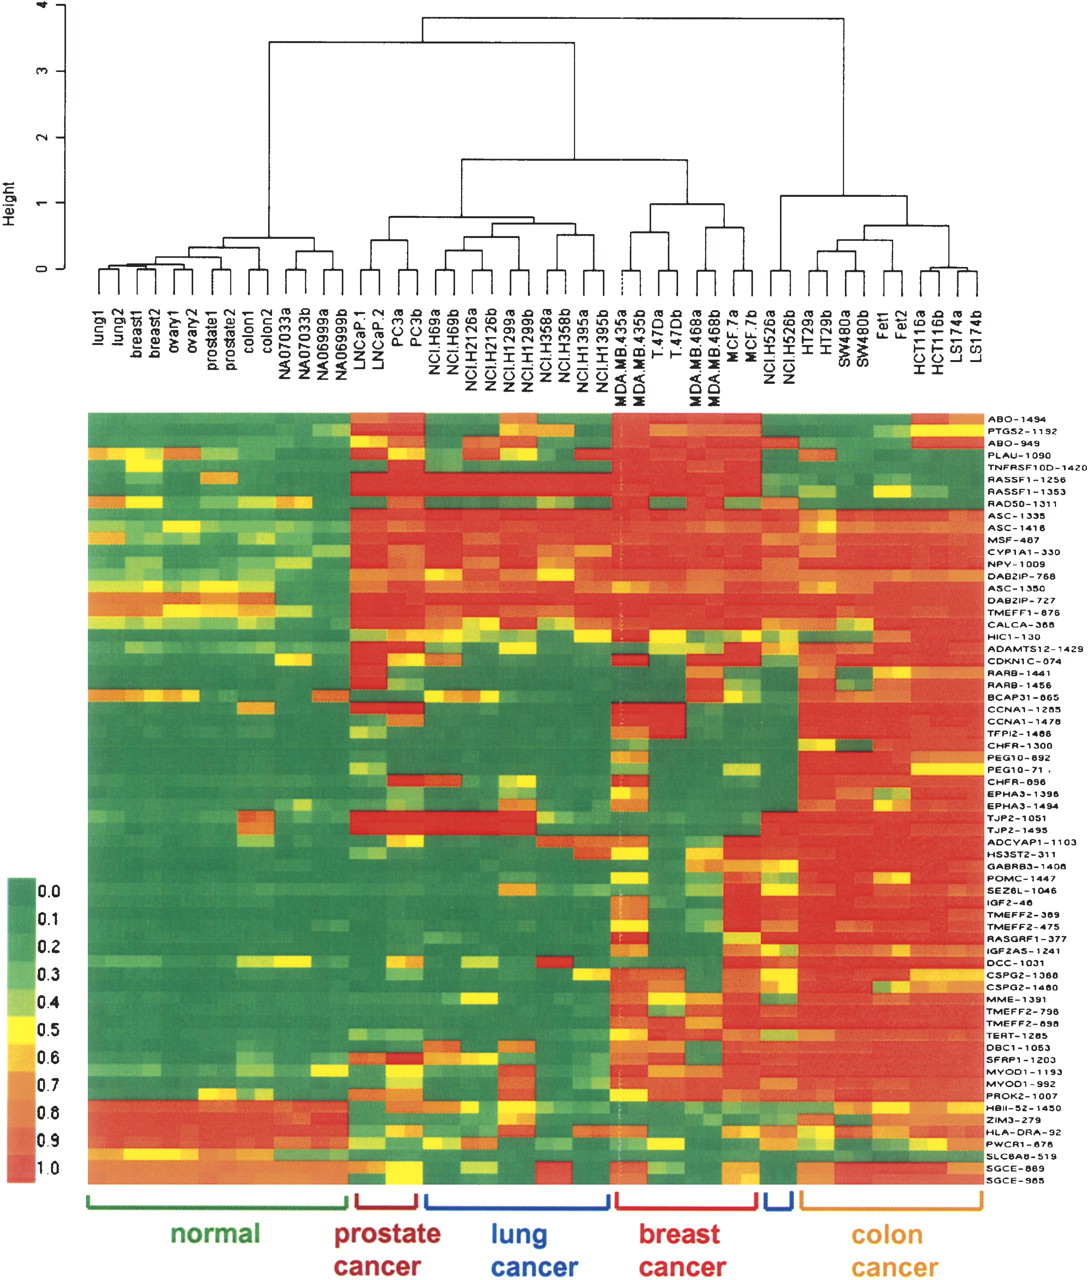
Figure 4.
Methylation profiling in cancer cell lines. Seven DNA samples derived from different normal tissues and 17 colon, breast, lung, and prostate cancer cell lines were profiled. All cancer samples were correctly separated from normal samples using agglomerative clustering based on 64 cancer-specific methylation makers, and highly specific methylation signatures were obtained for each cancer type. Green, yellow, and red colors represent low, medium, and high methylation levels, respectively.


