
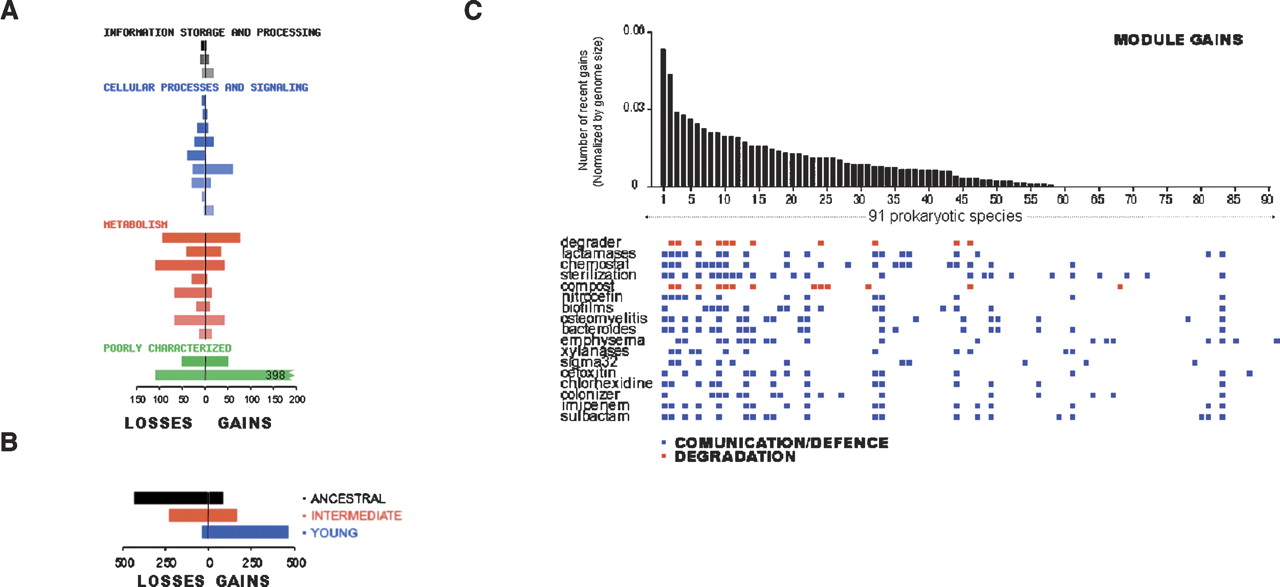
Relationship between module gain and specific phenotypes. (A) The functional categories of the OGs in modules that have been lost or gained in the 102 prokaryotic species are shown. A module is considered to be lost or gained when 70% or more of its OGs are lost or gained. Statistically significant functional enrichments of genes in cohesive modules over all genes are marked with asterisks (P-values < 10–2, calculated using a hypergeometric distribution with Bonferroni correction). (B) The number of OGs in the three age categories of the modules that are gained or lost is represented. (C) Phenotypic properties of species that have gained a higher number of modules. Species were sorted by the number of modules that have been gained since speciation from the closest relative in the tree, divided by total number of OGs in the species (see Table S5 for the species list). Phenotypic terms associated to the 20 species that have gained more modules among the 30 first terms significantly associated (P < 10–3) (one-tailed probability of the χ2 distribution, one degree of freedom), to these species are shown.


