
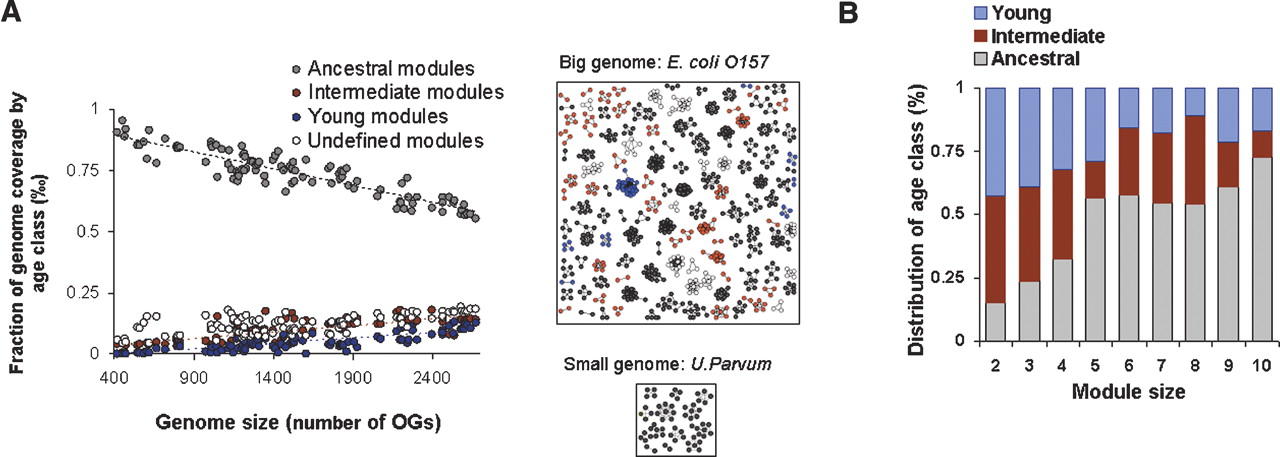
Figure 4.
Properties of ancestral, intermediate, and young modules. (A) Correlation of genome size with proportion of ancestral modules. For each prokaryotic species, the proportion of OGs in ancestral, intermediate, young, and undefined age modules are plotted against genome size (R2 values of the ancestral, intermediate, young, and undefined age classes are 0.85, 0.71, 0.41, and 0.69, respectively). The genome size is measured as number of OGs per species. An example of the number of modules in each age class in a large species (Escherichia coli O157: H7) and in a small species (Ureaplasma Parvum) is depicted. (B) Distribution of module size per age class.


