
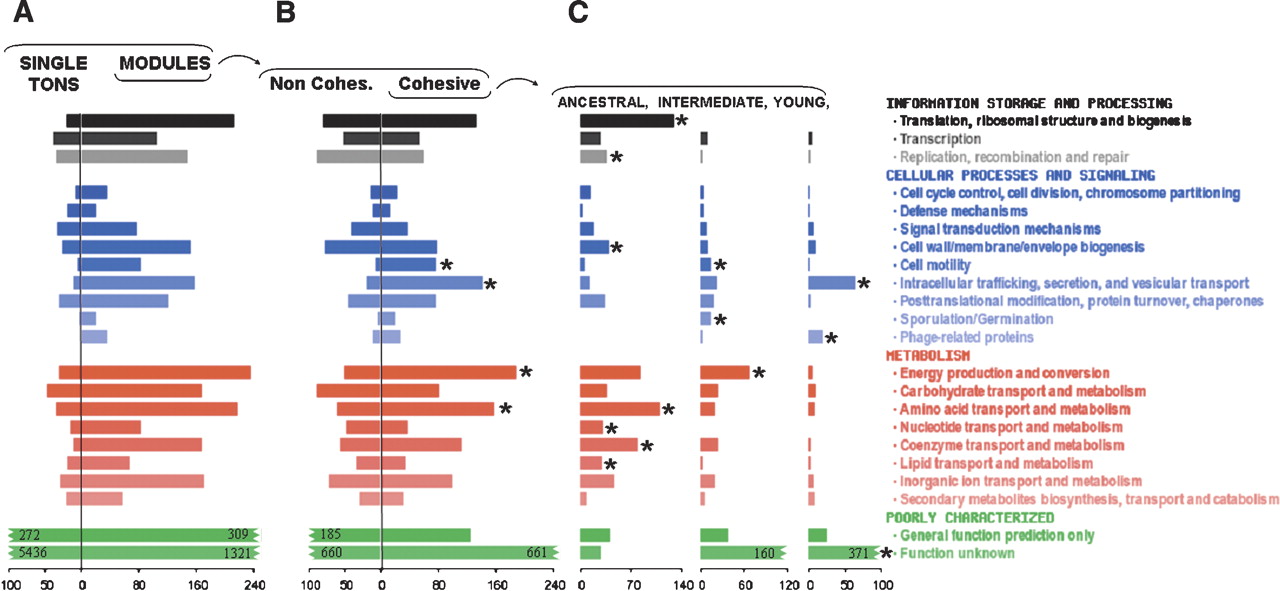
Functional characteristics of modules. The high-level categories defined for COGs (Tatusov et al. 2001) were used to assess functional differences between (A) OGs in modules versus unconnected singleton OGs, (B) cohesive and noncohesive modules, and (C) cohesive modules of different age classes. The total counts of each set are shown at the bottom. Colors reflect the hierarchical classification of functional categories, as in the COG database (Tatusov et al. 2001). Statistically significant functional enrichments of cohesive over noncohesive modules are marked with asterisks (P-values <10–2, calculated using a hypergeometric distribution with Bonferroni correction). In part (C), the statistical significance of functional enrichments was computed for each age class (asterisks), using the hypergeometric distribution as above.


