
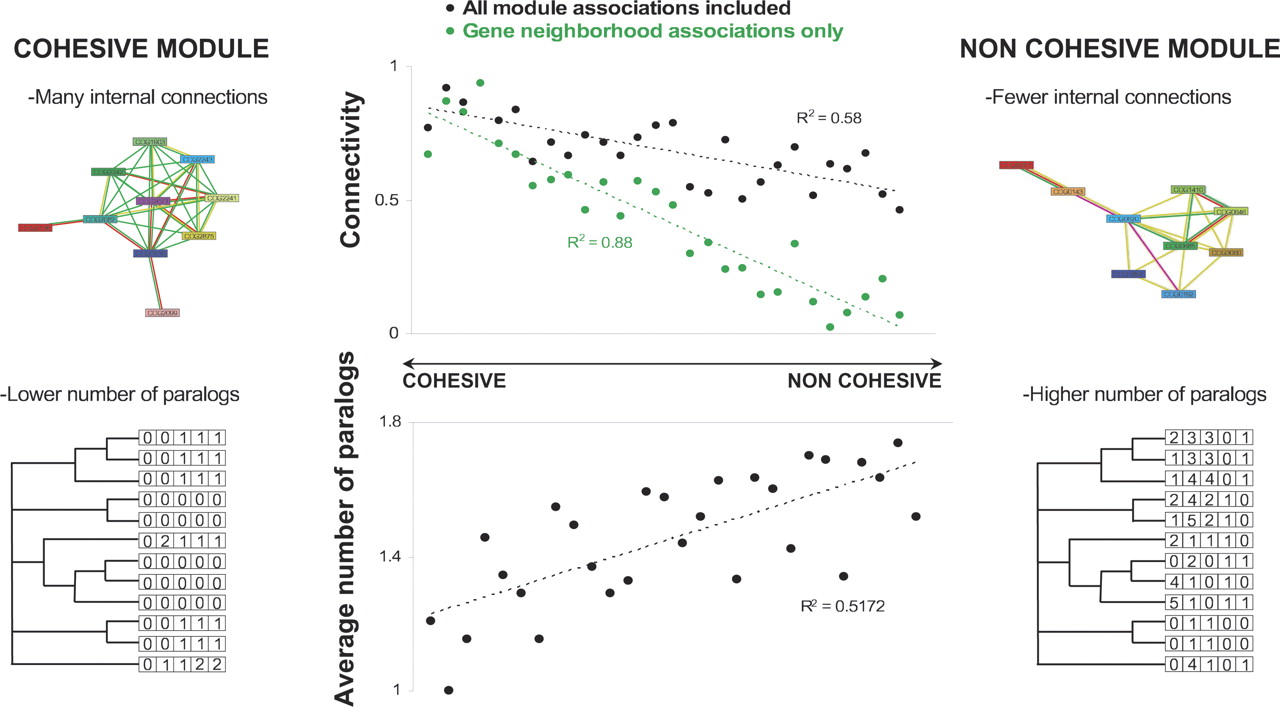
Properties of evolutionarily cohesive modules. Top: internal connectivity of modules. The internal connectivity is defined here as the number of actual connections between OGs divided by the number of possible connections. The connectivity of modules is plotted against their cohesiveness ranking (black), and for comparison the plot is repeated for the same modules but limiting the connections to the neighborhood associations (green, association score >700). Two examples that illustrate differences in internal connectivity of a cohesive and a noncohesive module are shown. The cohesive module (P = 10–8) contains genes for cobalamin (vitamin B12) biosynthesis and the genes of noncohesive module (P = 0.34) are implicated in methionine biosynthesis. Color code for connections: neighborhood, green; gene fusion, red; text-mining, yellow; experiments, violet. Bottom: average number of paralogs in a module. An example of a cohesive module is shown (plotting the number of paralogous genes for a subset of species; the module encodes a metabolic pathway involved in the conversion of succinate to propionate: COG1272, COG0427, COG1703, COG1884, P = 7 · 10–7), as well as an uncharacterized module with a lower cohesiveness (COG1305, COG0714, COG1721, COG1001, COG2252, P = 3 · 10–3). For both plots, modules were ranked according to evolutionary cohesiveness (P-value, only considering modules of size four or larger) and binned into groups of 10 modules.


