
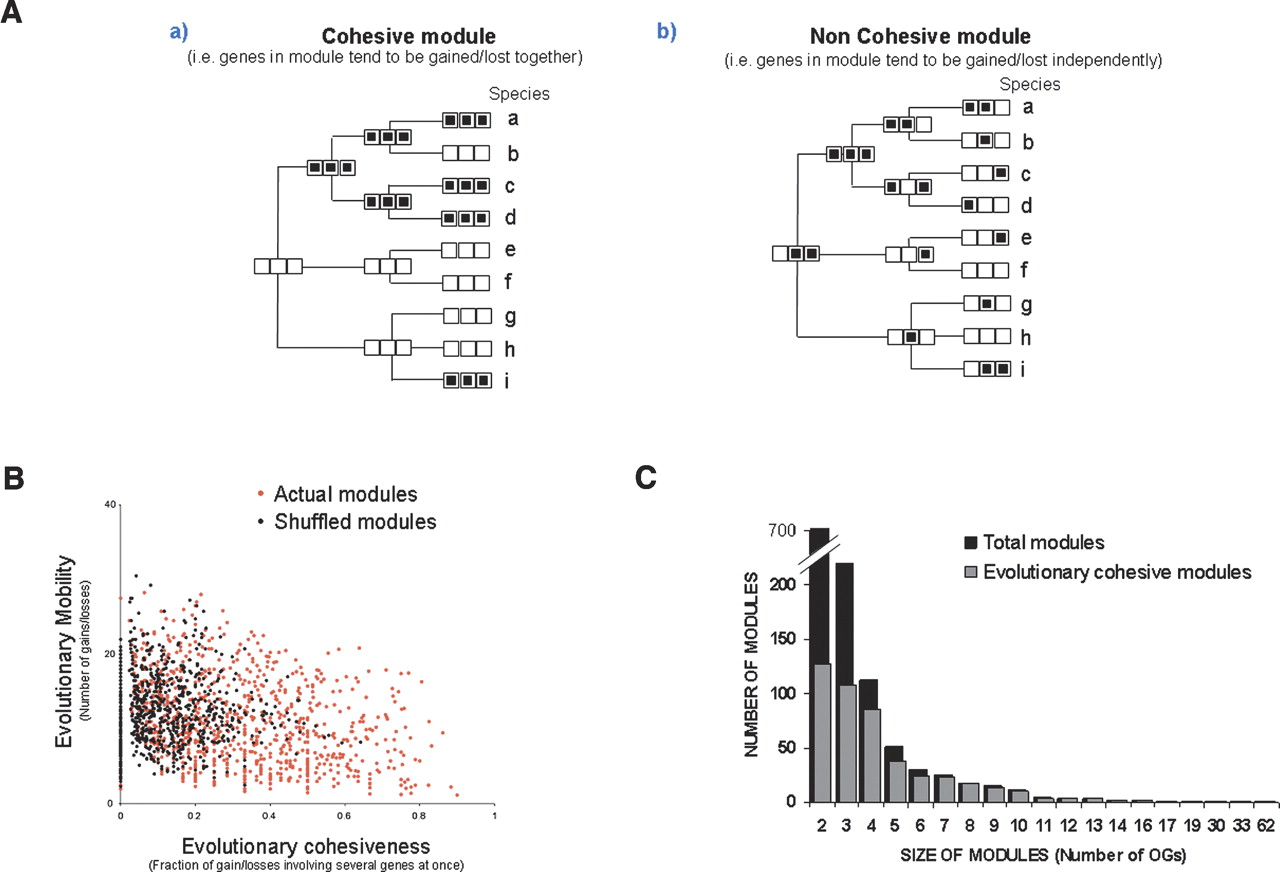
Figure 1.
Quantification of evolutionary cohesiveness. (A) A simplified example of the ancestral states of a cohesive functional module (a) and a noncohesive module (b). The presence of a gene in a species or ancestral state is indicated by a black square. (B) The two evolutionary parameters are plotted for prokaryotic functional modules and random modules. The “normalized total cost” and the “fraction of joined events” for the cohesive (a) and non cohesive (b) modules of Figure 1A are indicated. (C) Distribution of total modules and evolutionarily cohesive modules (P < 10–2), by module size.


