
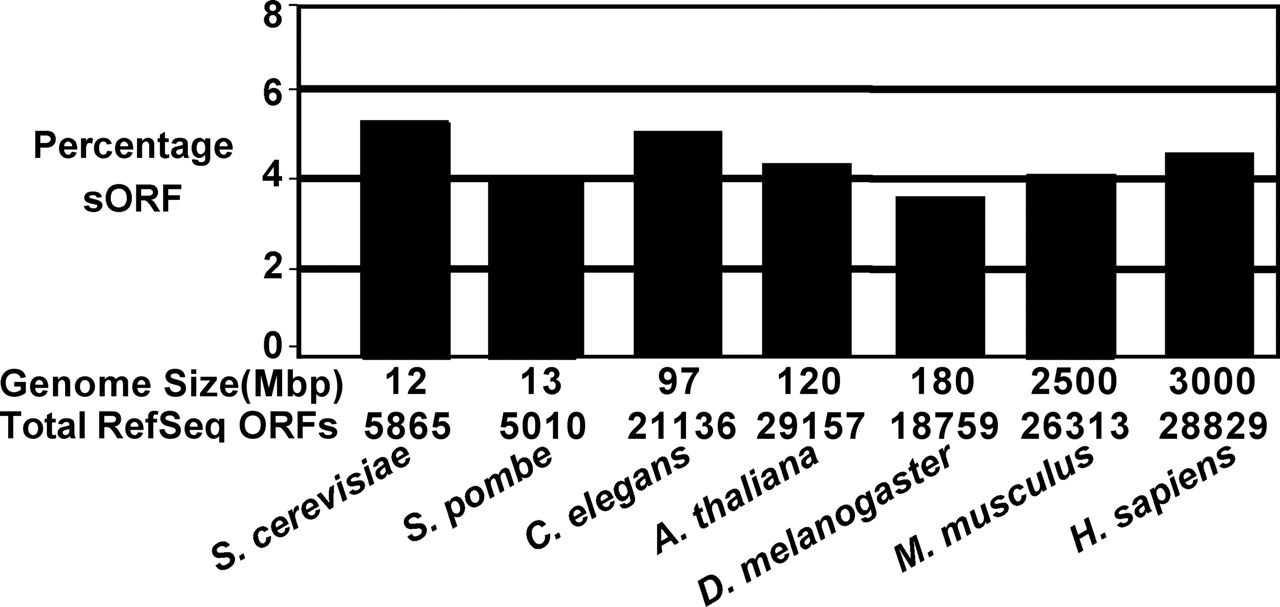
Figure 2.
sORFs constitute a similar percentage of annotated ORFs in representative eukaryotes. The percentage of sORFs for S. cerevisiae and representative eukaryotes was calculated and is depicted in the bar graph. The genome size (megabases) and the number of RefSeq ORFs for each eukaryote are displayed below the graph.


