
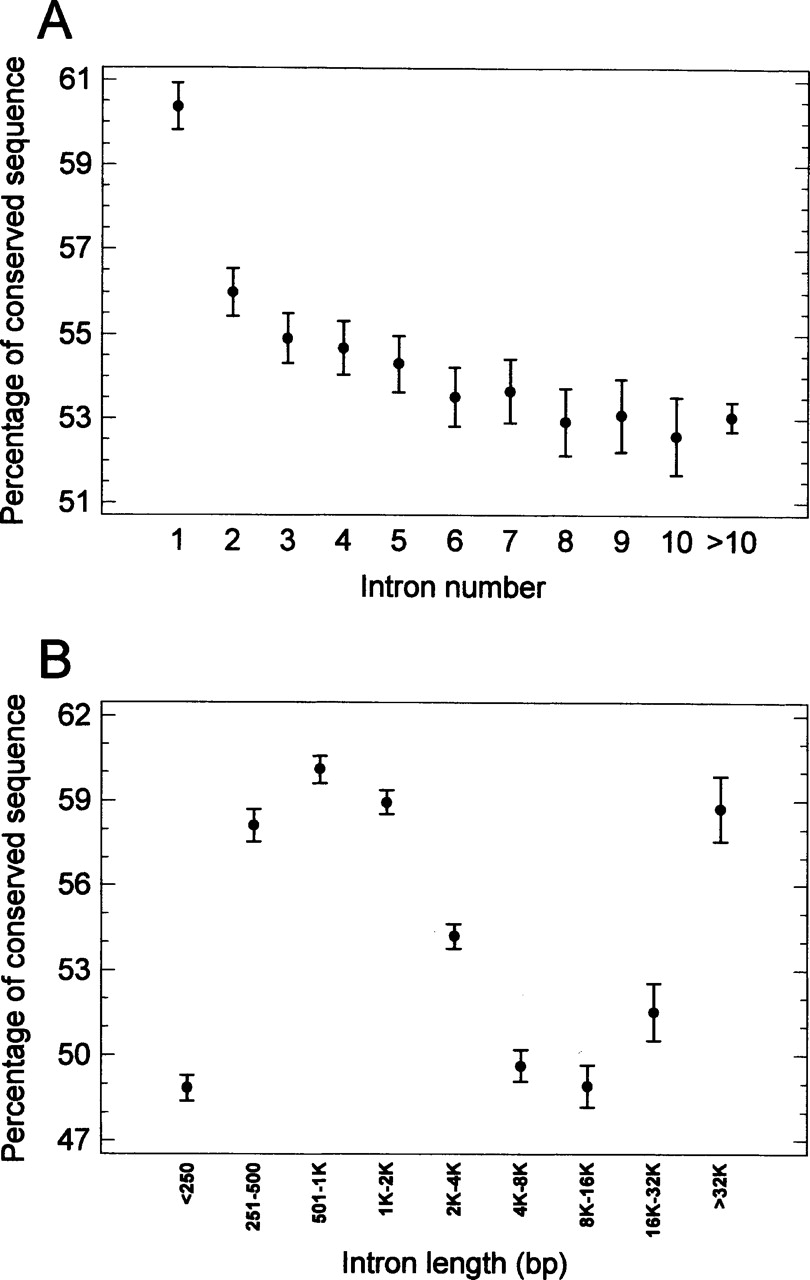
Figure 3.
The fraction of the conserved sequence (ratio of the conserved sequence length to intron length remaining after masking for lineage-specific repeats) in human introns (means with LSD intervals). (A) in first (and other) introns. (B) in different intron length classes. (For the correlation of conserved fraction with intron length, if all the introns were taken, Spearman r = –0.04, P <10–6, n = 65,432; if only introns containing the conserved fraction, Spearman r = –0.33, P < 10–6, n = 56,539. It should be noted that introns longer than 16 kb that show the rightmost upward trend in part B represent only <6% of the total intron number.)


