
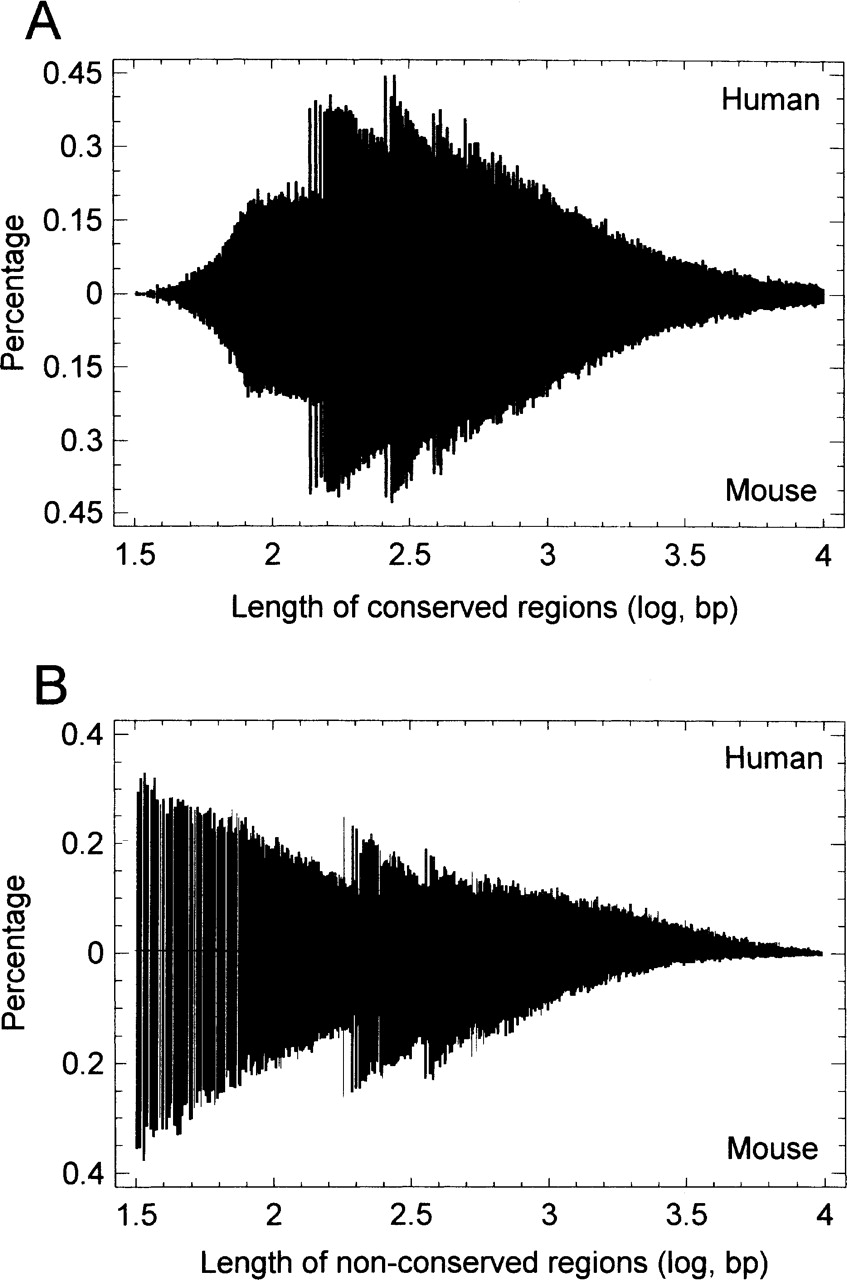
Figure 2.
Histograms of lengths of conserved (A) and nonconserved (B) regions. (The conserved regions are the nonoverlapped local alignments; the nonconserved regions are sequence segments between the two nearest consecutive local alignments or between the extreme alignment and the corresponding intron end.)


