
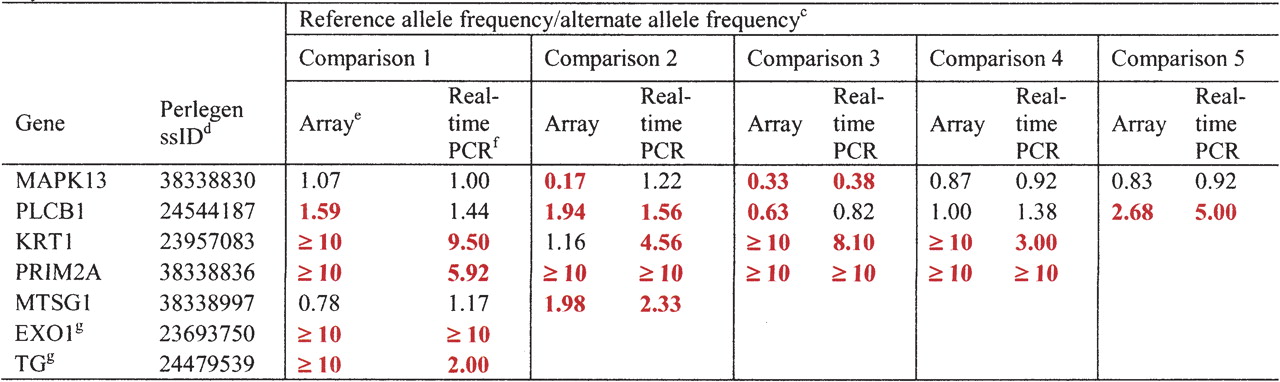
Ratio of reference allele frequency to alternative allele frequencya as measured by array hybridization and real-time PCRb
Click on table to view larger version.
-
aDifferentially expressed SNPs (≥1.5) are shown as bold and red.
bLinear regression on the ratios from the two methods gave a correlation coefficient, R2, of 0.707 (P = 9.317 × 10⁻⁷).
cThe comparisons were made in samples that were heterozygous for the exonic SNPs of each of the listed genes. Thus, the specific samples assayed for each gene varied.
dSNP identifiers used by NCBI's dbSNP for SNPs submitted by Perlegen.
eEstimated ratio of reference allele frequency to alternate allele frequency based on Δp from oligonucleotide array analysis, as described in Methods.
fEstimated ratio of reference allele frequency to alternate allele frequency based on ΔCt (Ct of reference allele — Ct of alternate allele) from real-time PCR experiments. Frequency (reference) = 1/(1 + 2EΔCt), as described by Germer et al. (2000).
gThese SNPs are not listed in Supplemental Tables 1 or 2 because they were not expressed in at least nine individuals.


