
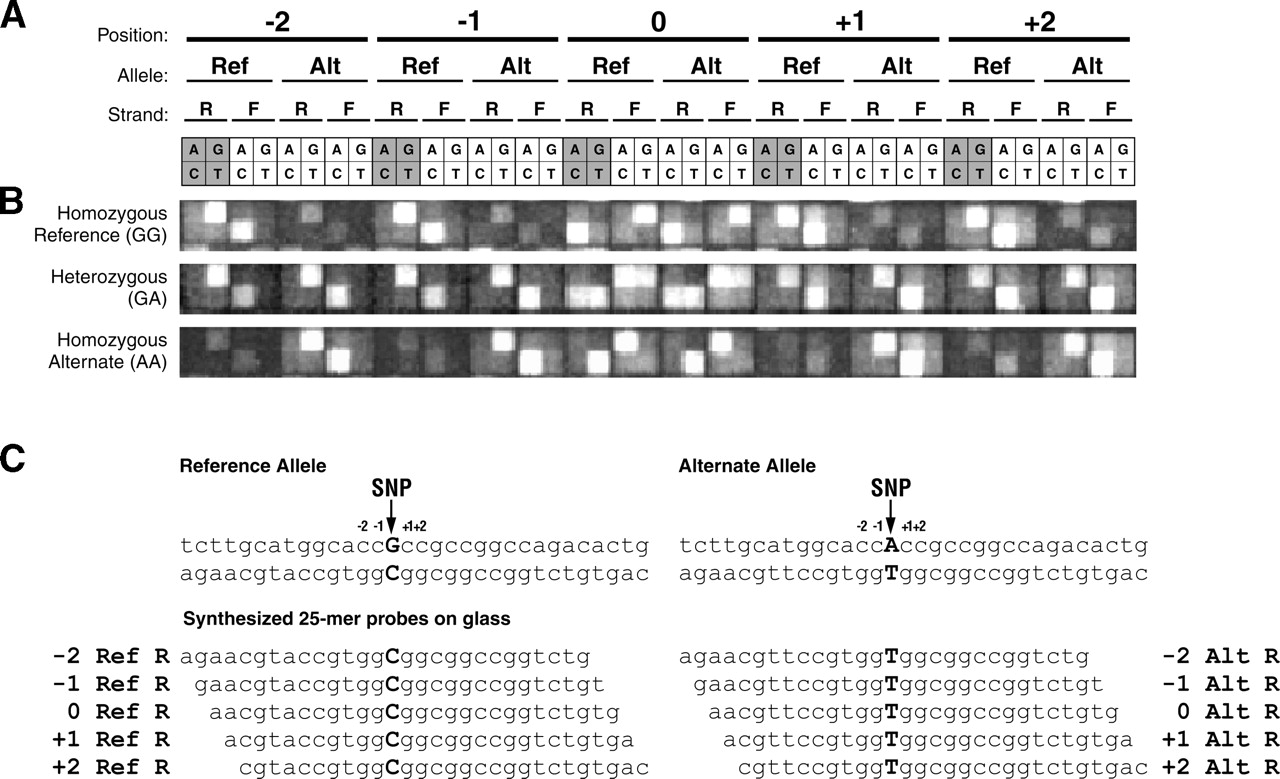
Layout of the high-density oligonucleotide arrays used for differential allelic expression analysis. (A) Each exonic SNP is interrogated by 80 distinct probes (25-mers), which consist of four sets of 20 features, corresponding to the forward and reverse strands of the reference and alternate SNP alleles (the set corresponding to the reverse strand of the reference allele is shaded). Each set of 20 features consists of five groups of four features. The five groups vary by their relationship to the position of the SNP, with the center of the 25-bp features being offset by –2, –1, 0, 1, or 2 bases from the SNP. The four features within a group differ only at the central nucleotide position to provide one perfect match probe and three mismatch probes. The arrangement of these four features in squares on the arrays is shown with the indicated nucleotides being those at the center position of each probe. Note that at the 0-offset position, the central nucleotide is also the SNP, meaning that the features tiled for the reference allele are identical to those tiled for the alternate allele. This results in an additional perfect match feature for the reference allele, bringing the total number of perfect match features to six. (B) Fluorescence images of identical arrays hybridized to three different DNA samples, the first homozygous for the reference SNP allele (GG), the second heterozygous (GA), and the third homozygous for the alternate allele (AA). (C) The sequences of the five perfect match probes for the set of 20 features corresponding to the reverse strand of the reference SNP allele (left) and the five perfect match probes for the set of 20 features corresponding to the reverse strand of the alternate allele (right) for the particular SNP being queried in B. The SNP alleles are shown in bold.


