
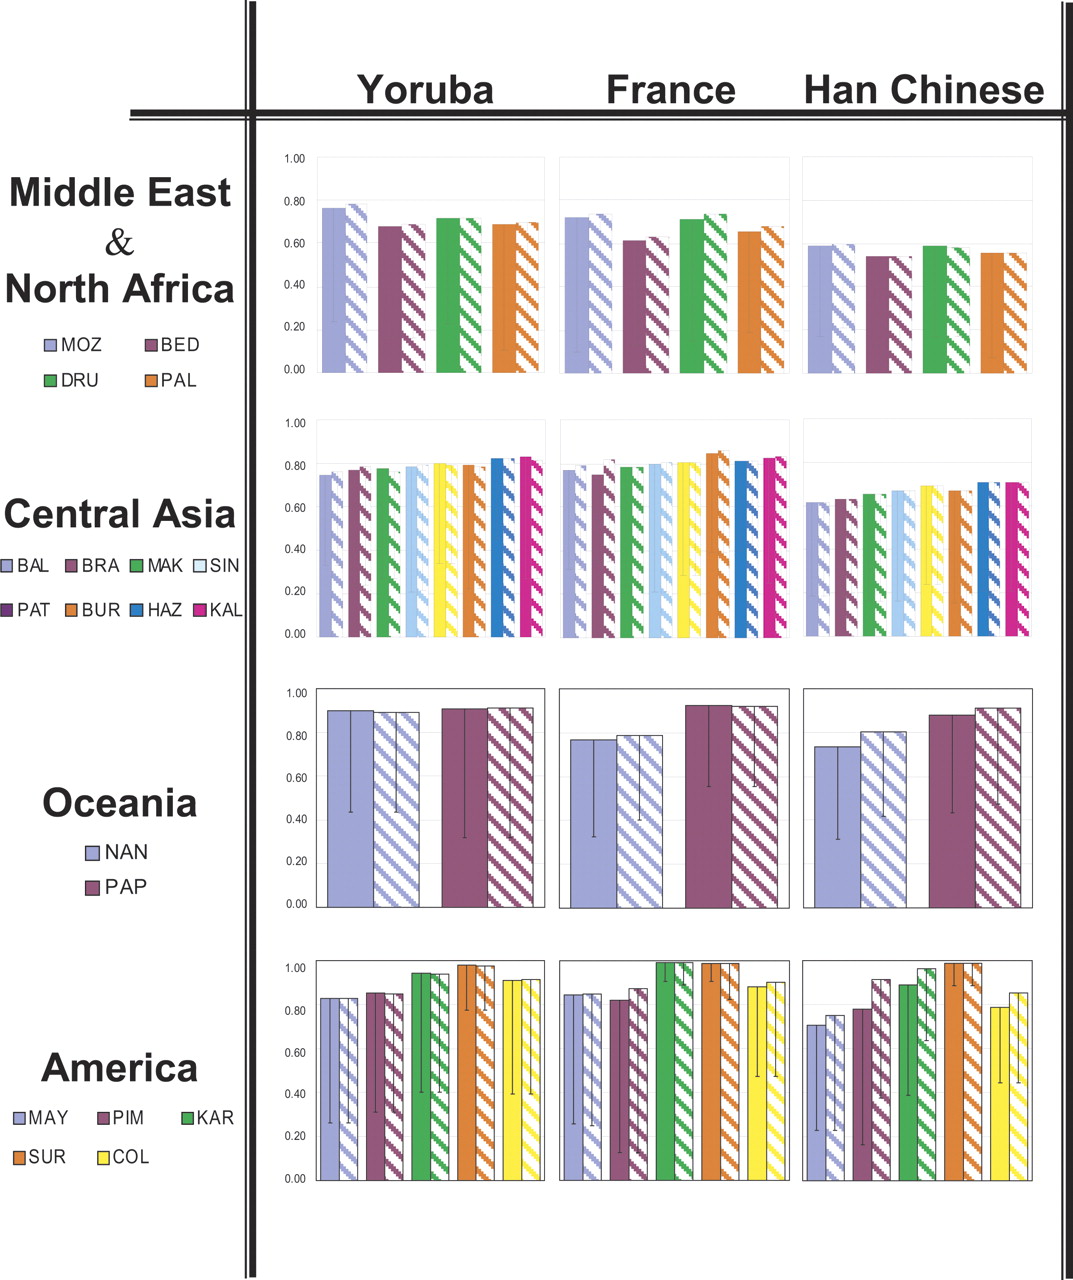
Figure 3.
Average maximum r2 obtained for non-tagSNPs when tagSNPs selected in the three reference populations are applied to populations of other geographic regions: Middle East, Central Asia, Oceania, and America. Population abbreviations are as in Table 1. For each case, results for the “blind” and “ideal” analysis are shown. Detailed information on the distribution can be found in Supplemental Table 1. The 95th percentile values are shown as central bars from each mean value.


