
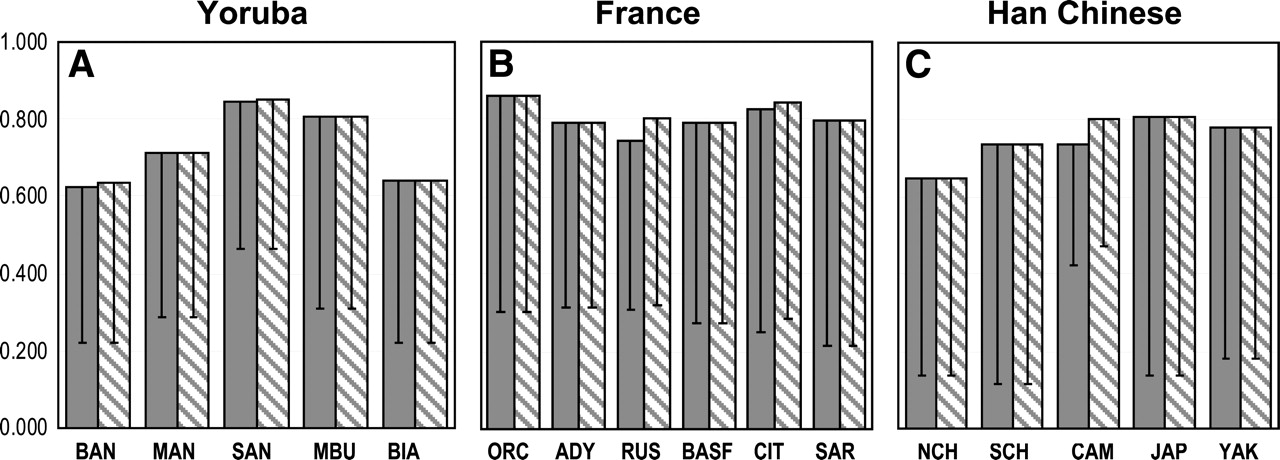
Average maximum r2 values of non-tag SNPs in a population with tagSNPs selected in HapMap proxy populations from the same geographic region. Population abbreviations are as in Table 1. An r2 threshold of 0.64 is used for tagSNP selection and evaluation. (A) Values when tagSNPs defined in Yorubas from Africa are used in the rest of African populations, (B) tagSNPs defined in French being used in the rest of European populations, (C) tagSNPs defined in Han Chinese being used in the rest of East Asian populations. For each case results for the “blind” test (opaque bars) and “ideal” test (dashed bars) are shown. Detailed information on number of SNPs and distribution of r2 values can be found in Supplemental Table 1. The 95th percentile values are shown as central bars from each mean value.


