
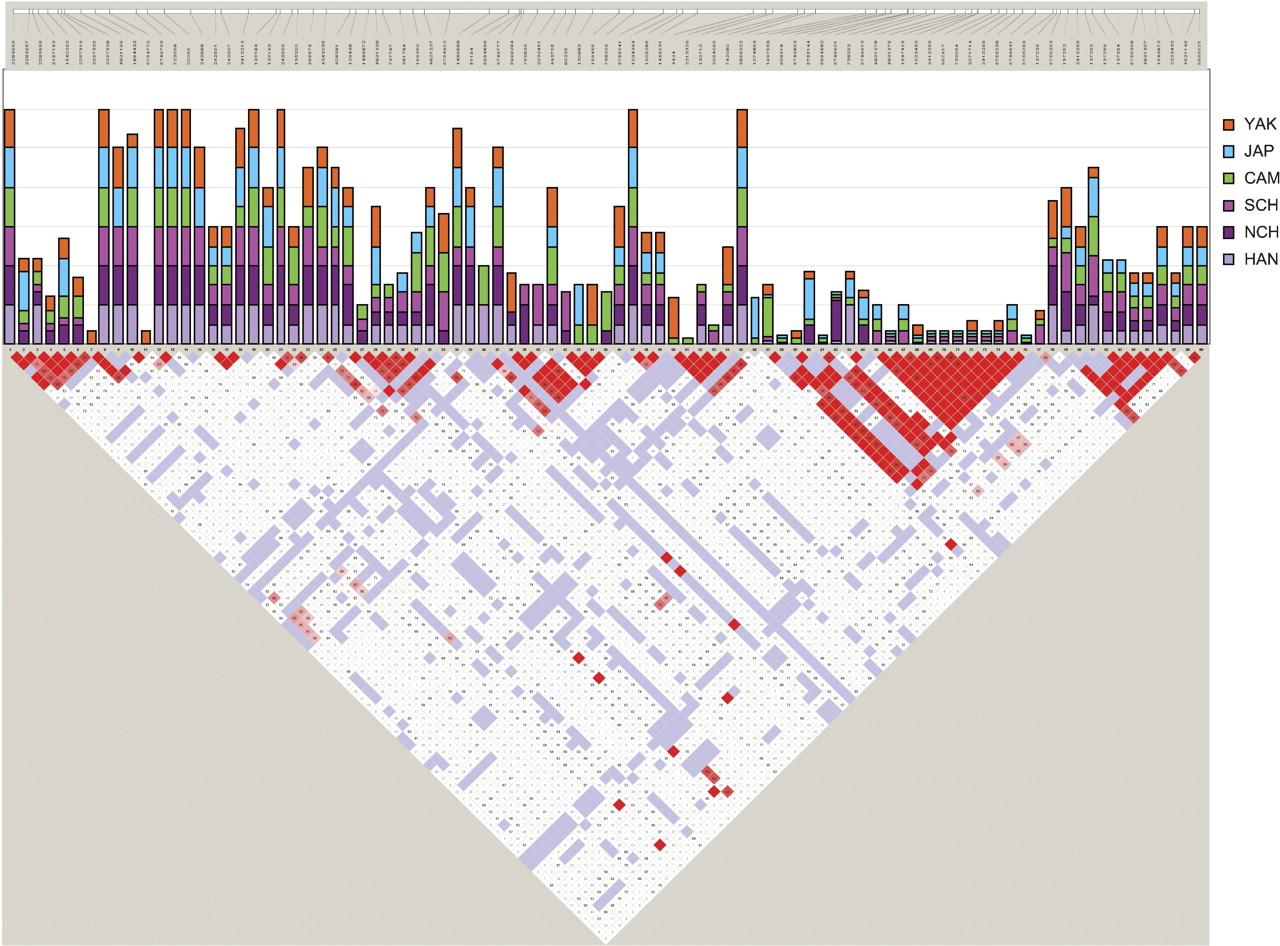
Plot of the probability of SNPs being tagSNPs (bar graph, upper middle), added together for the six Asian populations studied; the bar is made up by the sum of the probabilities in the six populations, and thus its maximum value is six. According to the ldSelect algorithm used for tagSNP selection, one or more SNPs within a bin can be specified as a tagSNP, and only one tagSNP need be genotyped per bin. Probability values are from 0 (no new information given by the SNP within the bin) to 1 (unique tagSNP selected in a bin). These values are compared with LD values (D′ parameter), shown in the bottom part of the figure as performed with the Haploview software package. In the D-plot, each diagonal represents a different SNP, with each square representing a pairwise comparison between two SNPs. (Red squares) Statistically significant LD between the pair of SNPs; (dark red) the higher values of D′, up to a maximum of 1. (White squares) Pairwise D′ values <1 with no statistically significant evidence of LD. (Blue squares) Pairwise D′ values of 1 but without statistical significance. (Top) Physical map of the region is shown. Population abbreviations are as in Table 1.


